Category: Brand Preference / Brand Persuasion
-

The Brand Advantage
CMOs don’t need more data. They need a system that shows what to do next. 𝗠𝗦𝗪 𝗕𝗿𝗮𝗻𝗱 𝗔𝗱𝘃𝗮𝗻𝘁𝗮𝗴𝗲 centers on Preference, the share of consumer desire in a category, and connects that measure to current and future market share, revenue, 𝘢𝘯𝘥 enterprise value. It models the drivers of Preference (𝘙𝘦𝘭𝘦𝘷𝘢𝘯𝘤𝘦, 𝘋𝘪𝘧𝘧𝘦𝘳𝘦𝘯𝘵𝘪𝘢𝘵𝘪𝘰𝘯, 𝘌𝘮𝘰𝘵𝘪𝘰𝘯𝘢𝘭 𝘈𝘥𝘷𝘰𝘤𝘢𝘤𝘺), quantifies perceptual…
-

Why Brand Preference is the Right Core Metric
If you can’t tie brand health to revenue, you’re tracking the wrong metric. At MSW, we use Brand Preference because it connects directly to business impact. It compresses the category’s demand structure into a finite resource, making it clear where you stand and what it will take to grow. Preference sits closest to competitive choice,…
-

Drivers of Brand Preference: The RDE Framework
If you want to grow brand preference, you need to know what moves it. There are three forces that reliably drive Brand Preference: ➡️ 𝗥𝗲𝗹𝗲𝘃𝗮𝗻𝗰𝗲: How well your brand fits the consumer’s needs, occasions, and emotions at the moment of choice ➡️ 𝗗𝗶𝗳𝗳𝗲𝗿𝗲𝗻𝘁𝗶𝗮𝘁𝗶𝗼𝗻: Meaningful distinctiveness that sets your brand apart ➡️ 𝗘𝗺𝗼𝘁𝗶𝗼𝗻𝗮𝗹 𝗔𝗱𝘃𝗼𝗰𝗮𝗰𝘆: A sense…
-

Cadence: Fewer Reads, More Signal
More tracking doesn’t mean better insight. Always-on measurement implies value proportional to frequency. In practice, it amplifies noise. The smarter approach is to time measurements to the consumer buying cycle and to known inflection moments like major campaigns, product changes, retail resets, and competitive launches. Sampling can then be sized to detect changes that matter,…
-

Targeting & Audience Design
Not every consumer has equal value to your brand. So why treat them all the same? Some are heavy users. Others barely engage. Some are loyal to your competition. Others are ready to be persuaded. That’s why tracking has to do more than report averages. It must reveal how each audience segment behaves, what they…
-

Growth Navigator 1
When’s the last time your brand strategy got a true reset? Every few years, even the best brands need a moment of strategic clarity. We helped one major snack brand do just that. The marketing team had no shortage of data. But they were stuck. Everything pointed backward. So we led a full brand strategy…
-

Growth Navigator 2
What would your brand strategy look like if it started with the truth instead of assumptions? Every brand has siloed data. But very few have a clear, unified strategy. That’s where Growth Navigator comes in. It helps align what truly matters. First, we identify the consumer truth. How people think, behave, and perceive the category.…
-

Giving Finance Confidence in Marketing’s Promises
Want marketing and finance on the same page? Start with preference. Too often, marketing and finance feel like they’re speaking different language. Finance wants to know: 𝘩𝘰𝘸 𝘸𝘪𝘭𝘭 𝘵𝘩𝘪𝘴 𝘪𝘯𝘷𝘦𝘴𝘵𝘮𝘦𝘯𝘵 𝘪𝘮𝘱𝘢𝘤𝘵 𝘵𝘩𝘦 𝘣𝘰𝘵𝘵𝘰𝘮 𝘭𝘪𝘯𝘦? That’s where preference becomes the bridge. There’s a quantifiable relationship between preference, share, revenue, and profit. If you can show how…
-

Brand Building Isn’t Dead. It’s More Important Than Ever.
An email about an upcoming marketing conference landed in my inbox. One line stopped me cold: They said… “𝘎𝘰𝘯𝘦 𝘢𝘳𝘦 𝘵𝘩𝘦 𝘥𝘢𝘺𝘴 𝘰𝘧 𝘣𝘳𝘢𝘯𝘥-𝘣𝘶𝘪𝘭𝘥𝘪𝘯𝘨 𝘴𝘵𝘳𝘢𝘵𝘦𝘨𝘪𝘦𝘴 𝘥𝘦𝘴𝘪𝘨𝘯𝘦𝘥 𝘵𝘰 𝘤𝘳𝘦𝘢𝘵𝘦 𝘭𝘪𝘧𝘦𝘭𝘰𝘯𝘨 𝘭𝘰𝘺𝘢𝘭𝘵𝘺.” Wow! Let’s be clear, that is completely wrong! The idea that brand building is outdated or obsolete doesn’t line up with the evidence, or with…
-
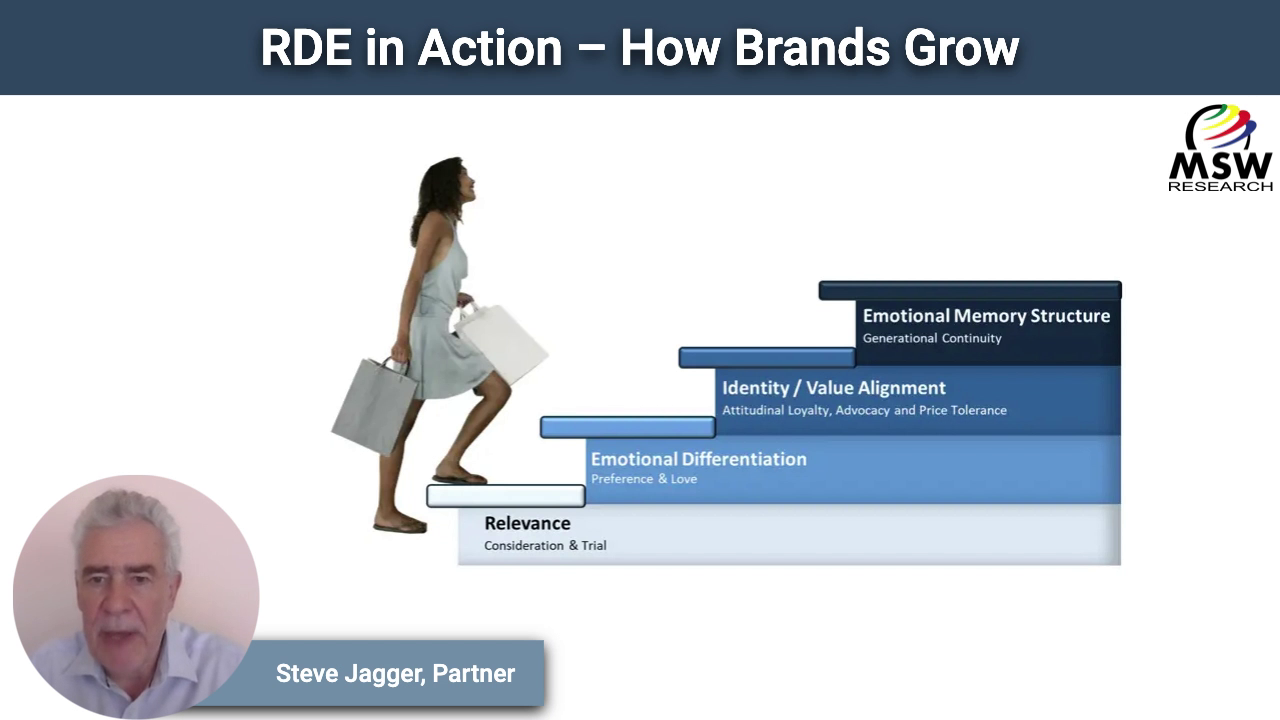
🚀 𝗥𝗗𝗘 𝗶𝗻 𝗔𝗰𝘁𝗶𝗼𝗻 – 𝗛𝗼𝘄 𝗕𝗿𝗮𝗻𝗱𝘀 𝗚𝗿𝗼𝘄
Forget what you’ve heard – brands don’t grow through loyalty. They grow through 𝗽𝗲𝗻𝗲𝘁𝗿𝗮𝘁𝗶𝗼𝗻: more people choosing them more often. And what drives choice? 𝗣𝗿𝗲𝗳𝗲𝗿𝗲𝗻𝗰𝗲. RDE explains how to build that Preference: • 𝗥𝗲𝗹𝗲𝘃𝗮𝗻𝗰𝗲 fuels trial. • 𝗗𝗶𝗳𝗳𝗲𝗿𝗲𝗻𝗰𝗲 enables price strength. • 𝗘𝗺𝗼𝘁𝗶𝗼𝗻 drives advocacy and memory. We’ve used this approach with clients across categories,…