Category: Brand Preference / Brand Persuasion
-
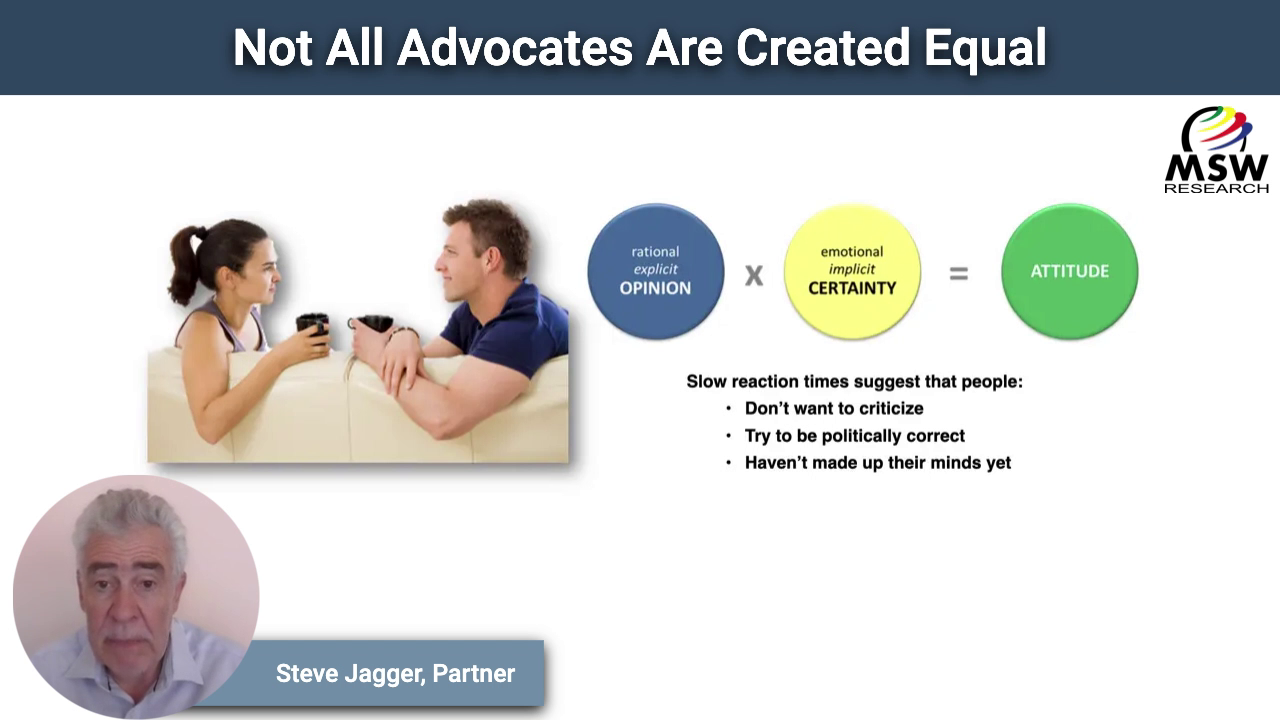
🔥 𝗡𝗼𝘁 𝗔𝗹𝗹 𝗔𝗱𝘃𝗼𝗰𝗮𝘁𝗲𝘀 𝗔𝗿𝗲 𝗖𝗿𝗲𝗮𝘁𝗲𝗱 𝗘𝗾𝘂𝗮𝗹
Last time, we broke down the three key drivers of Brand Preference: Relevance, Difference, and Advocacy. But here’s the twist—𝗻𝗼𝘁 𝗮𝗹𝗹 𝗔𝗱𝘃𝗼𝗰𝗮𝗰𝘆 𝗶𝘀 𝗲𝗾𝘂𝗮𝗹. Some consumers only recommend your brand if asked. Others—true Apostles—promote your brand unprompted because they’re emotionally invested. That’s the “E” in 𝗥𝗗𝗘—𝗘𝗺𝗼𝘁𝗶𝗼𝗻𝗮𝗹 𝗖𝗼𝗻𝗻𝗲𝗰𝘁𝗶𝗼𝗻. We measure it through 𝗿𝗲𝘀𝗽𝗼𝗻𝘀𝗲 𝘁𝗶𝗺𝗲, a proven…
-
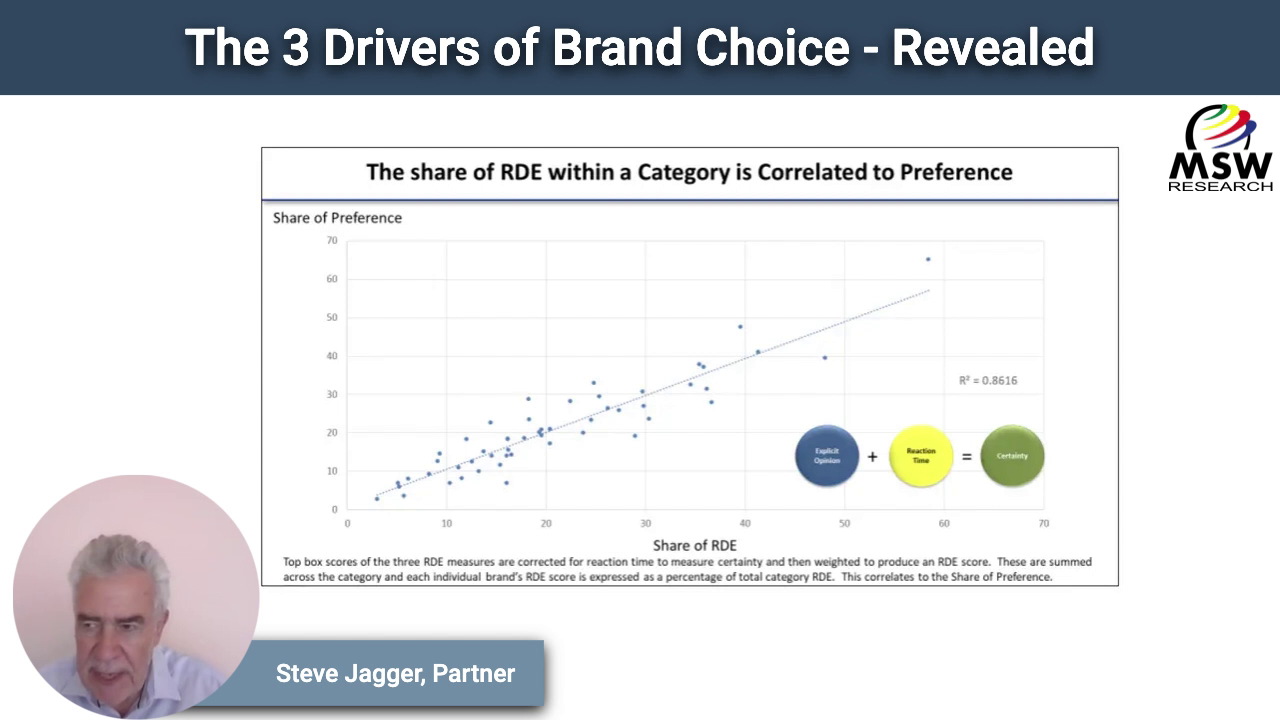
🎯 The 3 Drivers of Brand Choice – Revealed
Why do consumers prefer one brand over another? We ran a landmark study across 12 categories and over 30,000 evaluations to find out. The answer? Three core perceptions that consistently explain Brand Preference: • 𝗥𝗲𝗹𝗲𝘃𝗮𝗻𝗰𝗲 – “This brand is for someone like me.” • 𝗗𝗶𝗳𝗳𝗲𝗿𝗲𝗻𝗰𝗲 – “This brand stands out.” • 𝗔𝗱𝘃𝗼𝗰𝗮𝗰𝘆 – “I’d recommend…
-
What we do, how we do it and how our clients benefit
What we do: How we do it: How our clients benefit: “…MSW has been validated to actual business results more than any other advertising measurement in the business.” – Quirks “…MSW copy testing system, TouchPoint, provides quantitative prediction of the likelihood and magnitude of ad impact on future sales volume and market share.” – the Marketing Accountability Standards…
-

Brand Health, Equity, or Ad Tracking? Get Clarity.
The first step in designing a tracking study is to identify what your goal is and what you want to do with it. Do you need a Brand Equity, Brand Health or Advertising Tracker? Or some combination? So let’s first define each… Some researchers lump Brand Equity and Brand Health into the same bucket but…
-
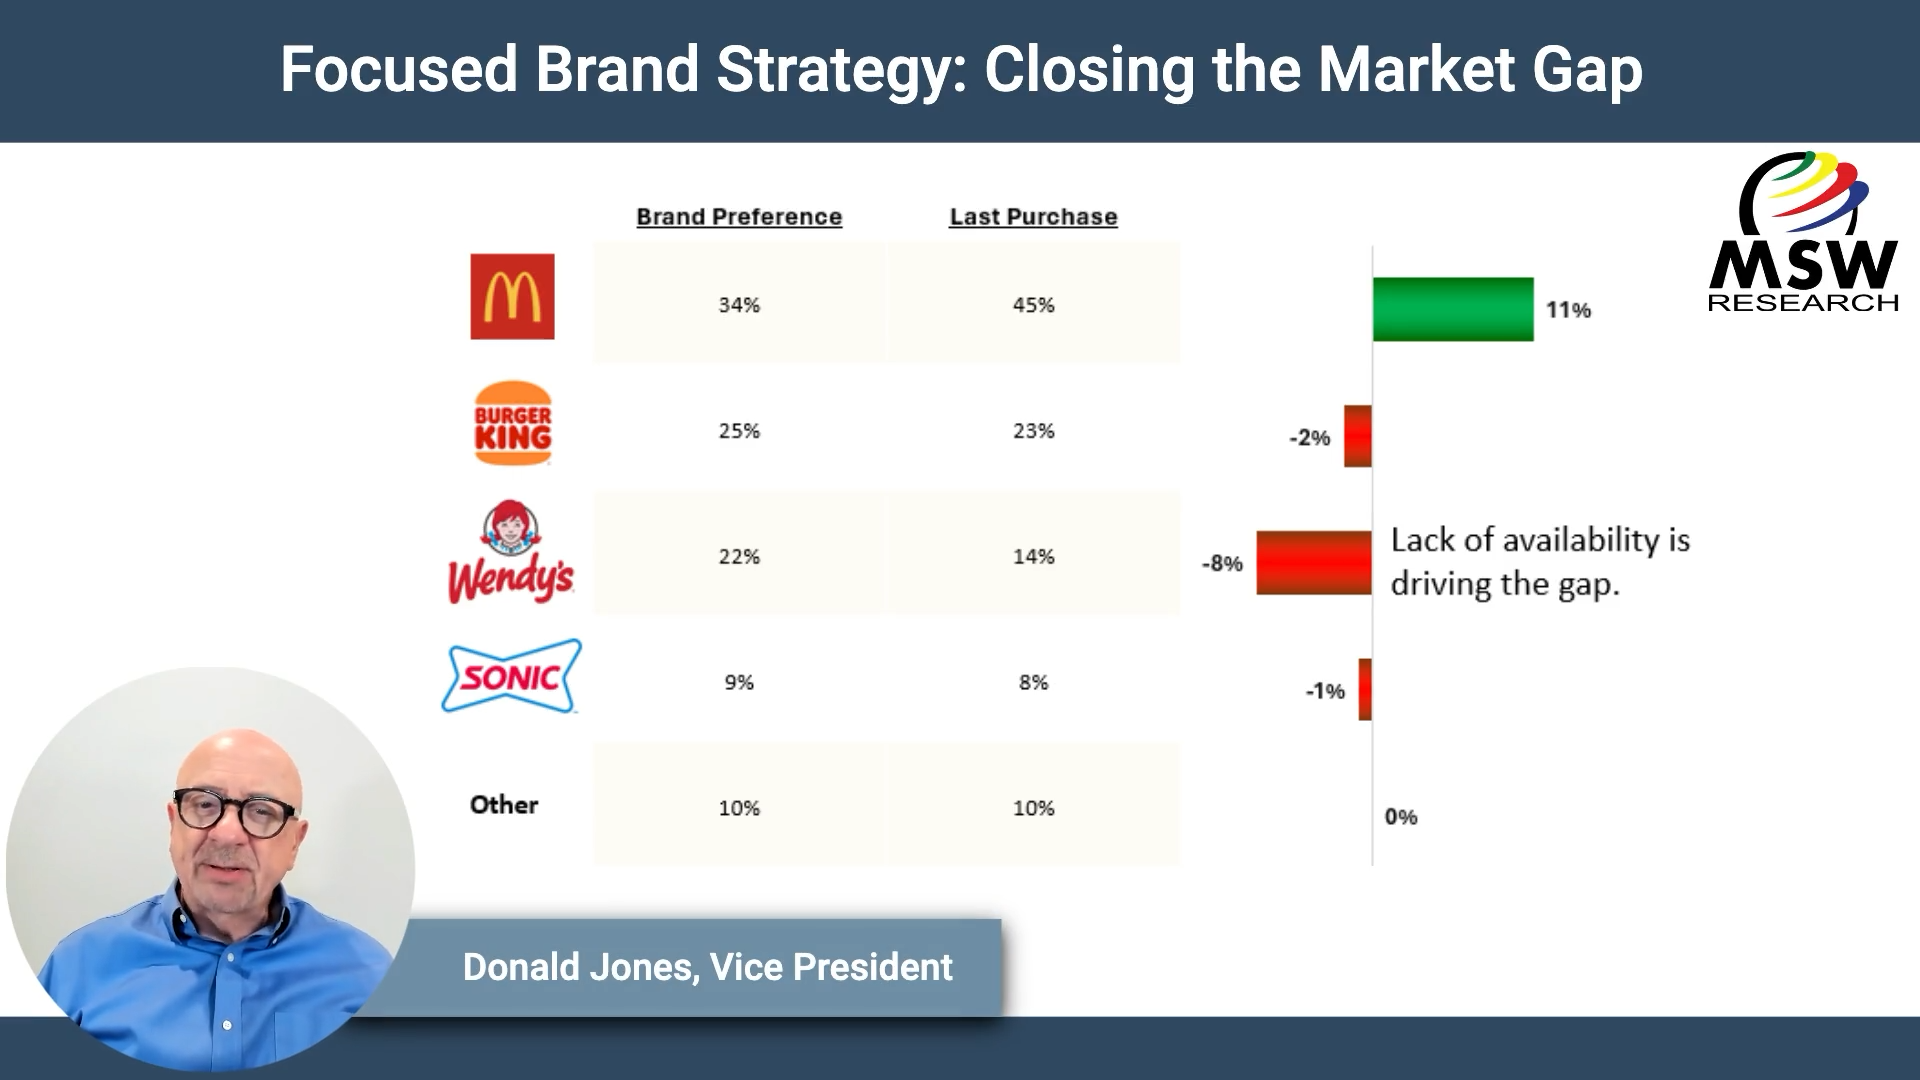
| Video Blog | Focused Brand Strategy: Closing the Market Gap
Forget what you think you know about market dominance. In 2023, MSW Research looked at consumer behavior for 4 popular fast-food chains. Our findings revealed that McDonald’s commands an impressive 11% positive market gap. 🍔 But where do these customers even come from? People who prefer other fast-food brands but can’t get to them. Take…
-
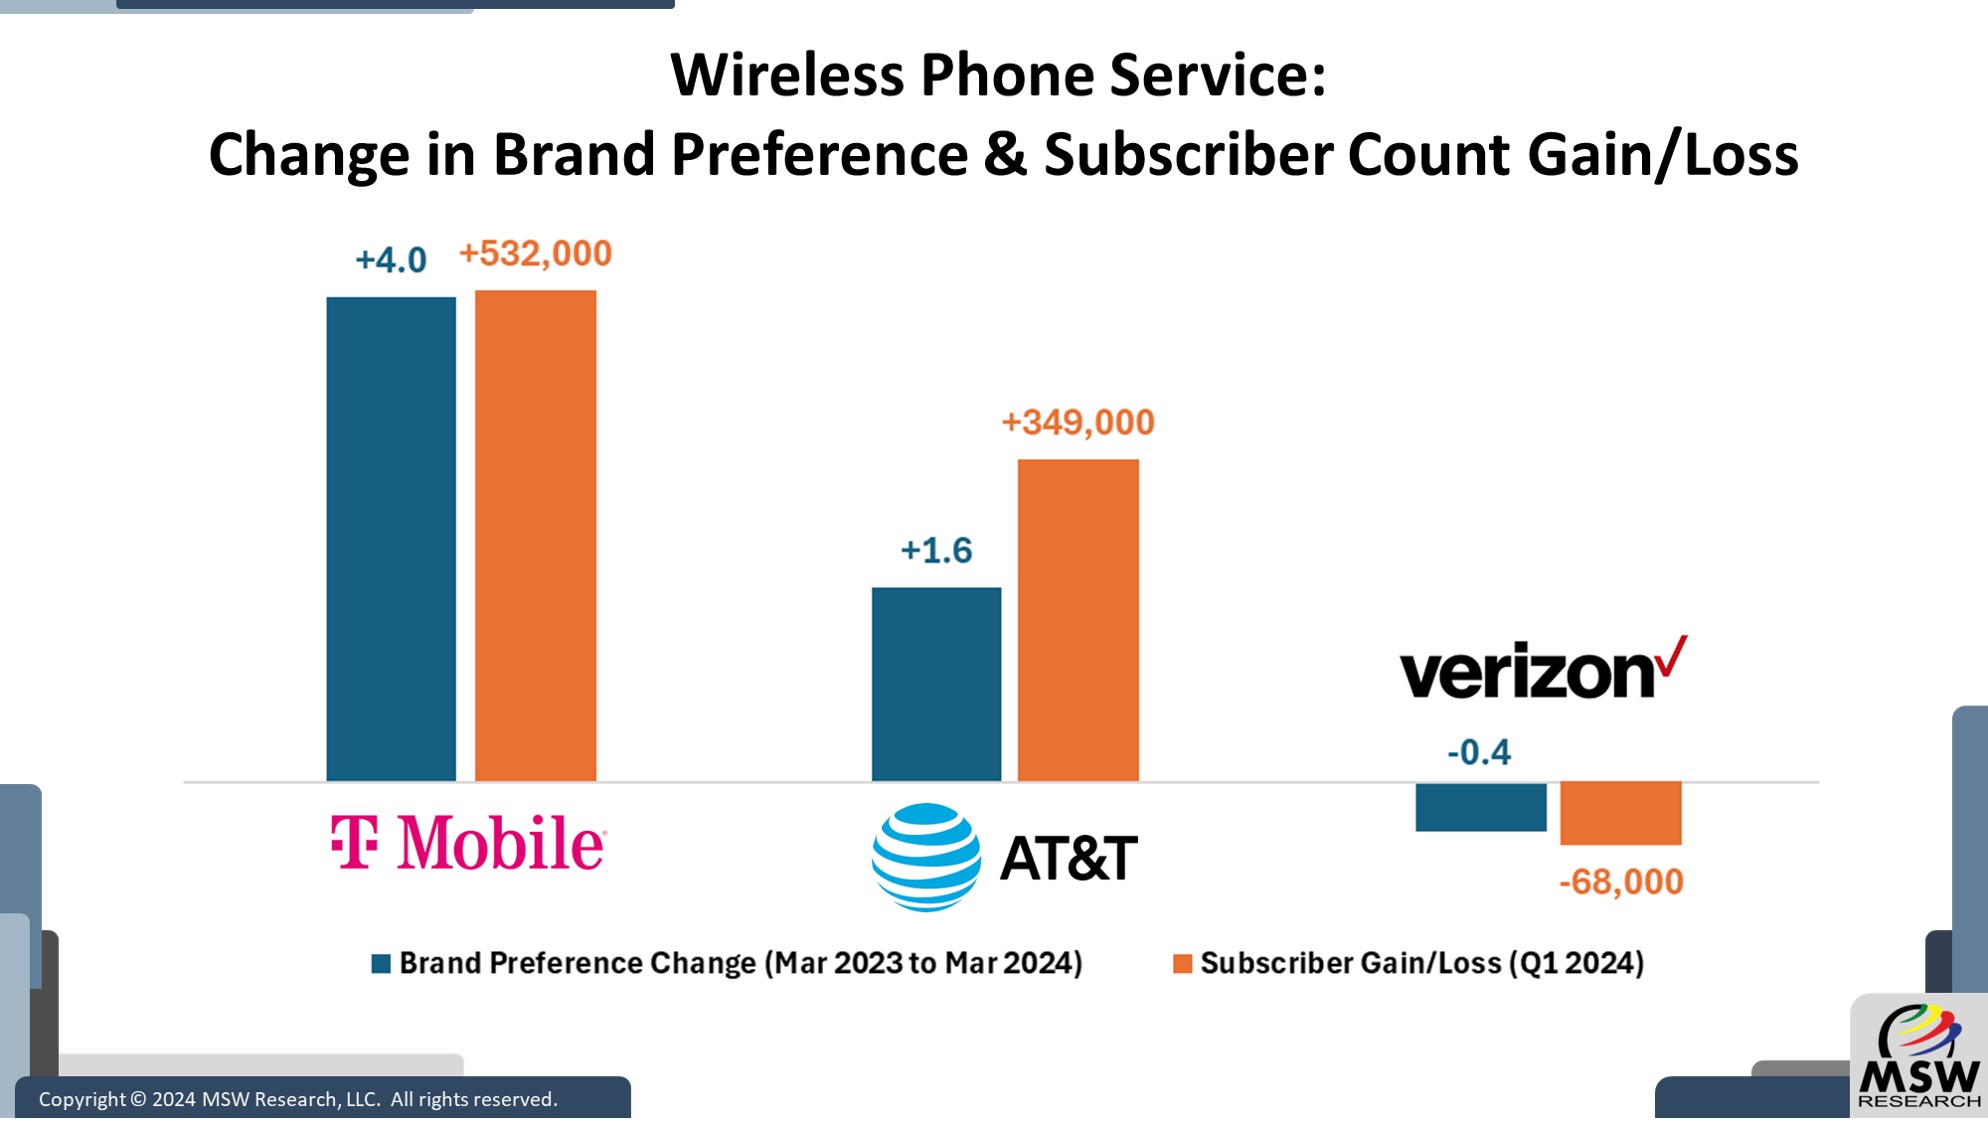
| Chart of The Week | Wireless Phone Service: Change in Brand Preference & Subscriber Count Gain/Loss
The MSW TBSM tracking service measures Brand Preference as one component of the survey. Wireless Phone Service category, changes in Brand Preference levels between March 2023 and March 2024 were computed for individual brands. Our Chart of the Week displays these results for the three top players in the U.S. Wireless Phone Service market: AT&T,…
-
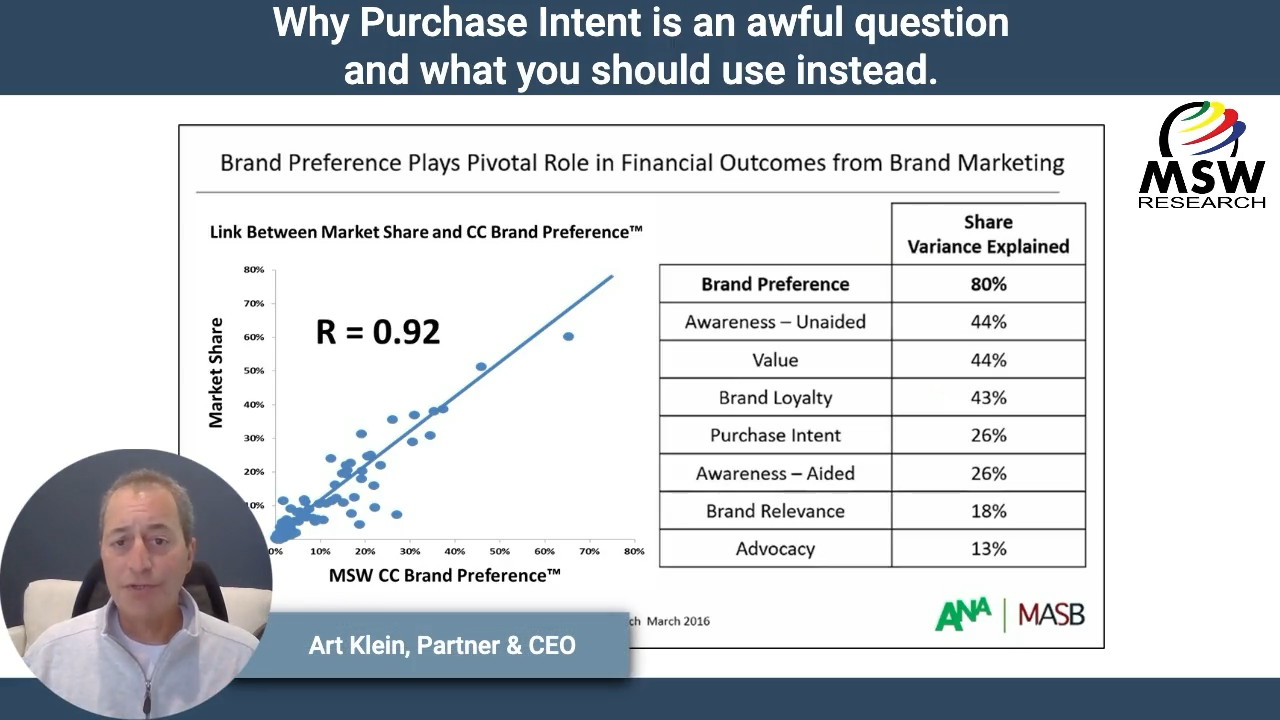
Why Purchase Intent is an awful question and what you should use instead
Using purchase intent as a decision metric in advertising research? Terrible idea. Here’s why: 1️⃣ It’s not predictive of sales. MSW’s Brand Preference correlates to sales at 0.87, rising to 0.92 with price and availability factored in. 2️⃣ Purchase intent asks the wrong question. MSW’s brand preference forces consumers to make a choice, reflecting true…
-
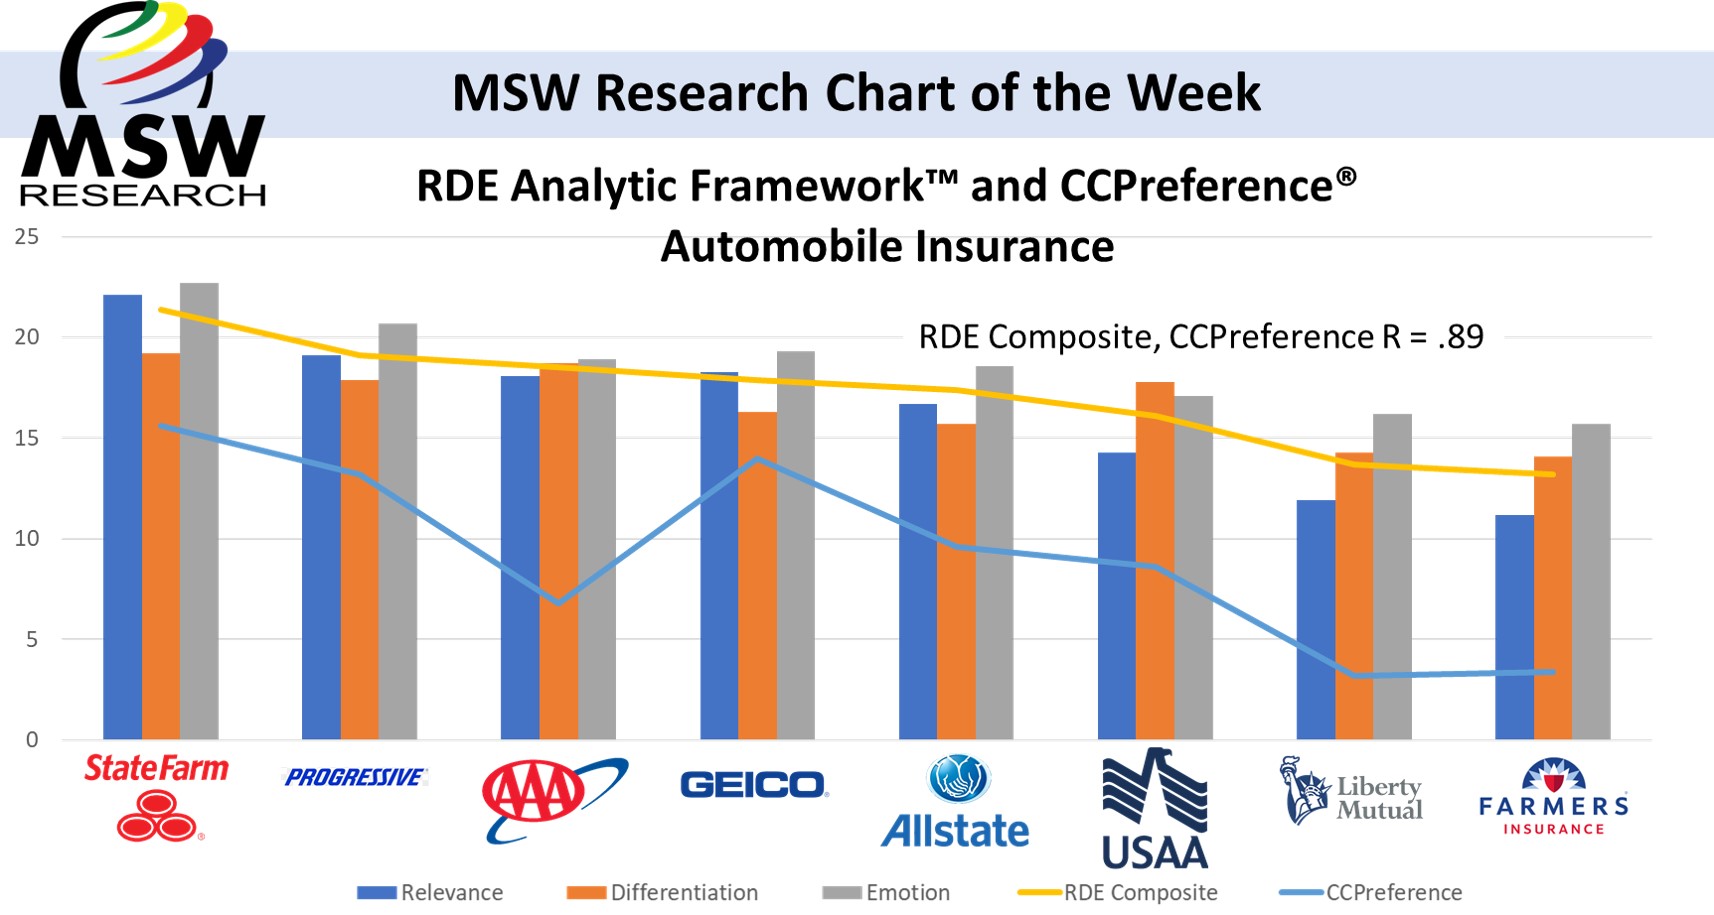
| Chart of The Week | Automobile Insurance: Change in Brand Preference and Share 2021 vs 2023
The MSW TBSM tracking service measures brand preference as one component of the survey. Using TBSM Auto Insurance category data, changes in brand preference results between 2021 and 2023 were computed for individual brands. Our Chart of the Week displays these results for the three top players in the US Auto Insurance market: State Farm,…
-
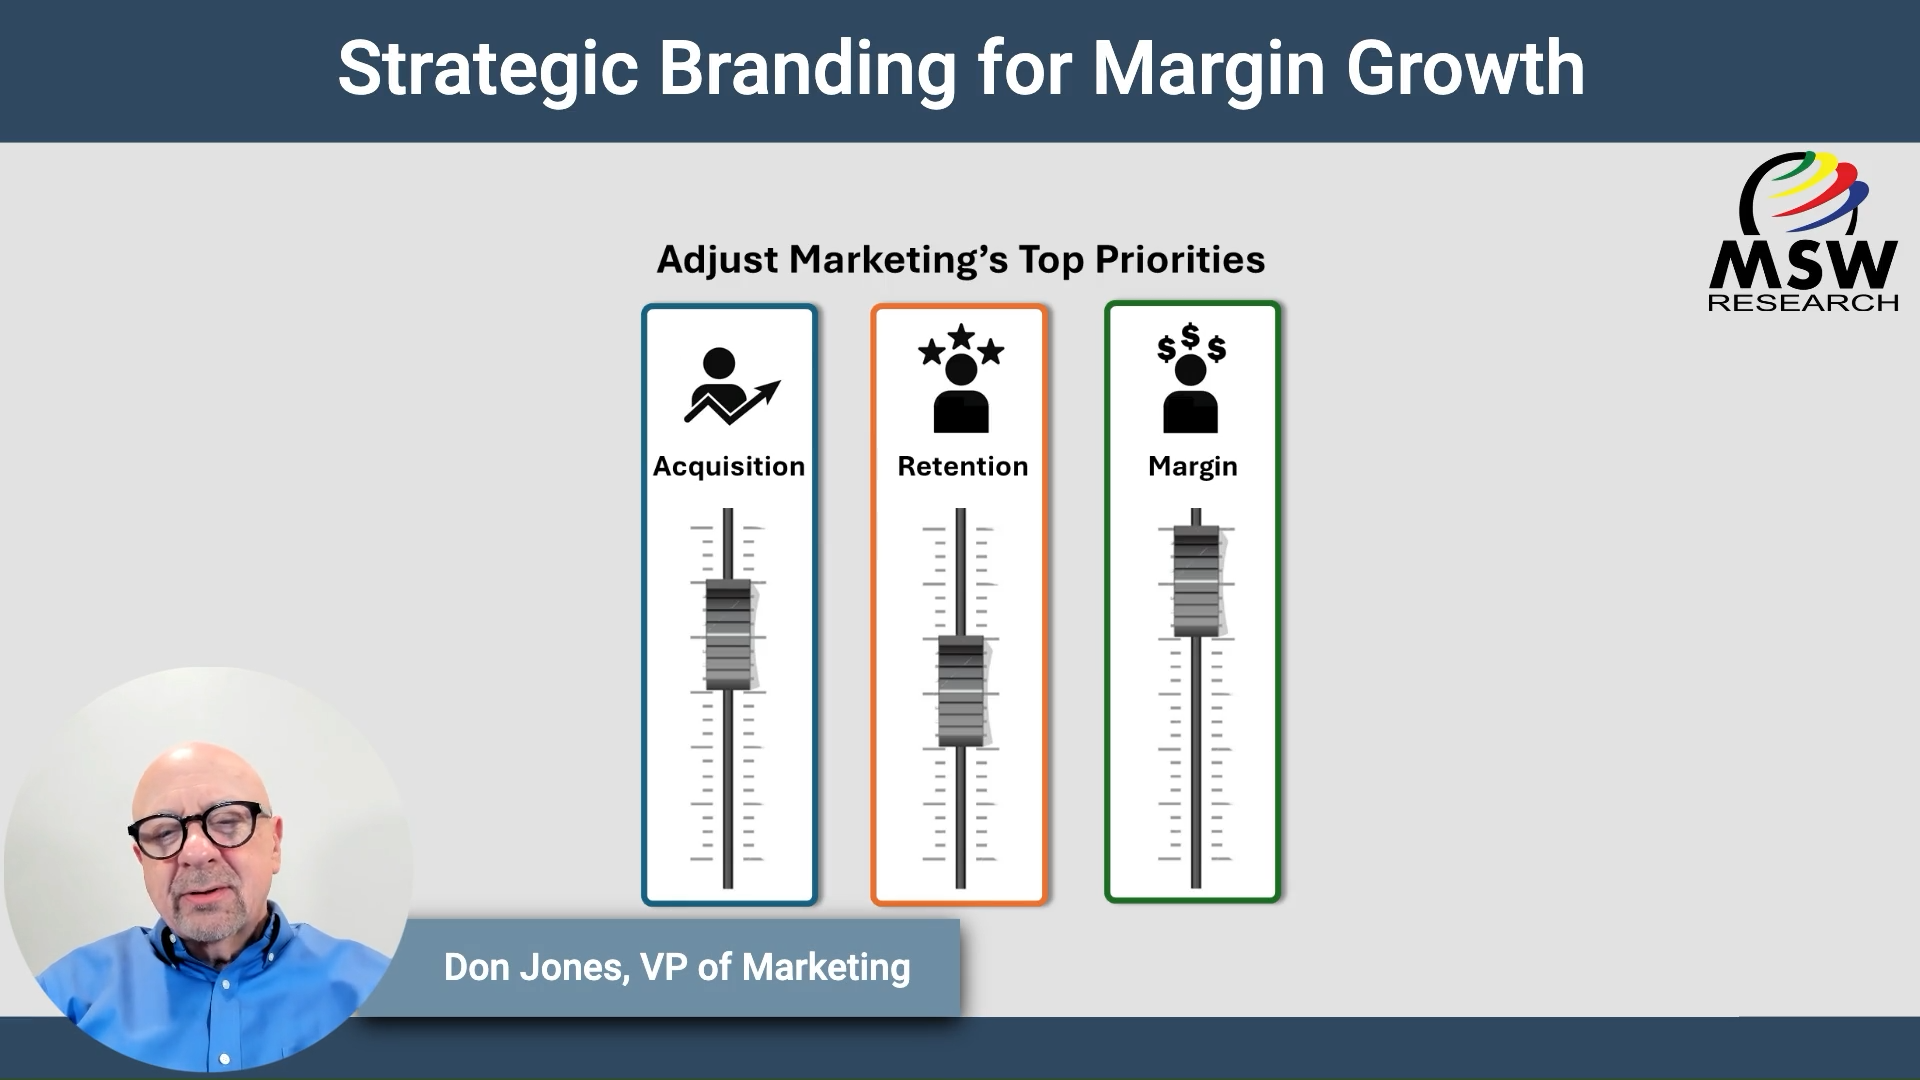
| Video Blog | Strategic Branding for Margin Growth
In the realm of successful brands, one thing stands out: distinctive brand assets. Whether it’s a memorable color, logo, design, or jingle, these cues aid in memory encoding and signal availability. Yet, the true value of these assets lies in the eyes of consumers. They expect a return on their investment in terms of time,…
-
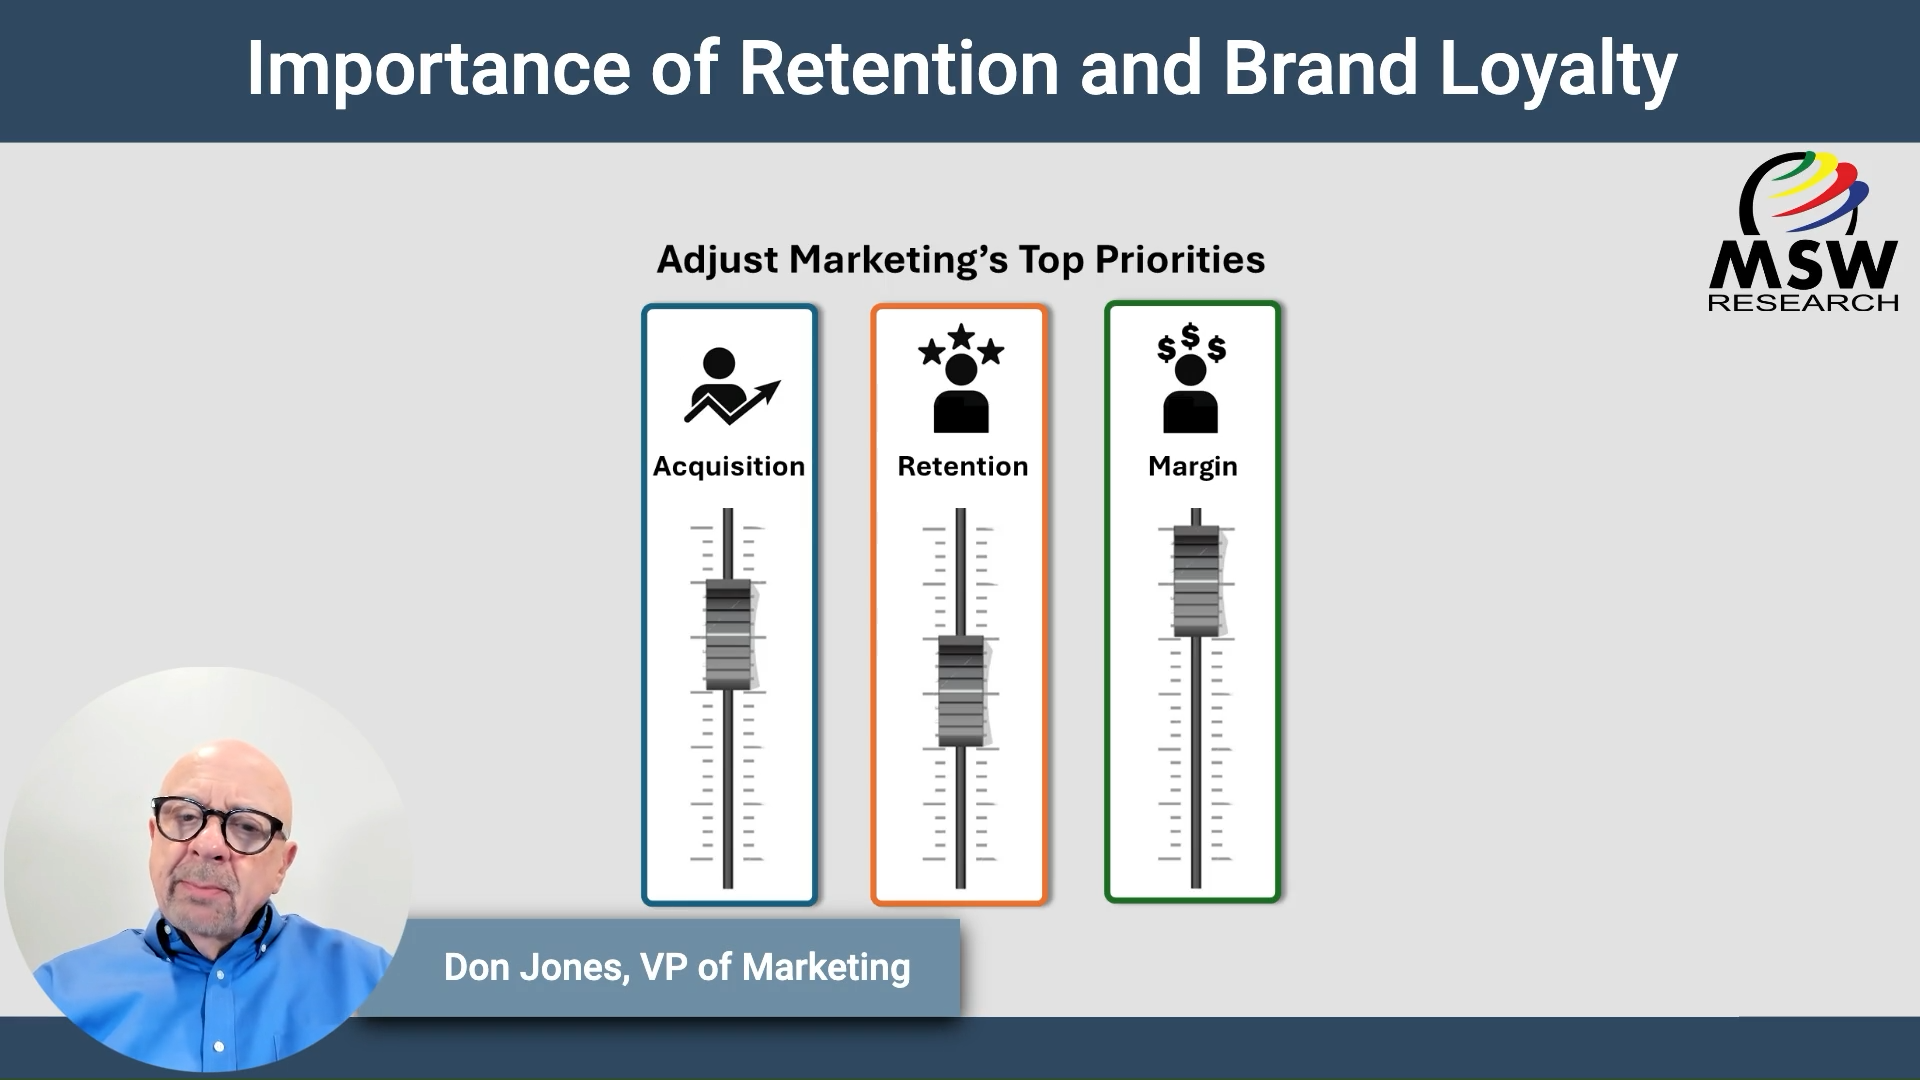
| Video Blog | Importance of Retention and Brand Loyalty
In the world of brands, loyalty reigns supreme. Yet, the truth is, most consumers aren’t loyal to any single brand. At MSW Research, we delve beyond behavioral loyalty, focusing on attitudinal loyalty—the kind that makes a brand their top choice, their go-to. Our research reveals a stark reality: only half of all customers feel loyal…