Category: Chart of The Week
-

Fast Casual Trends: These Chickens Are Flying!
In recent months, the headlines have been filled with news about the struggles that restaurants, particularly quick serve and fast casual, have had as a result of price inflation. To a large extent, this can be traced to the fact that prices for food away from home continue to rise faster than prices for food…
-
MSW Research Chart of The Week
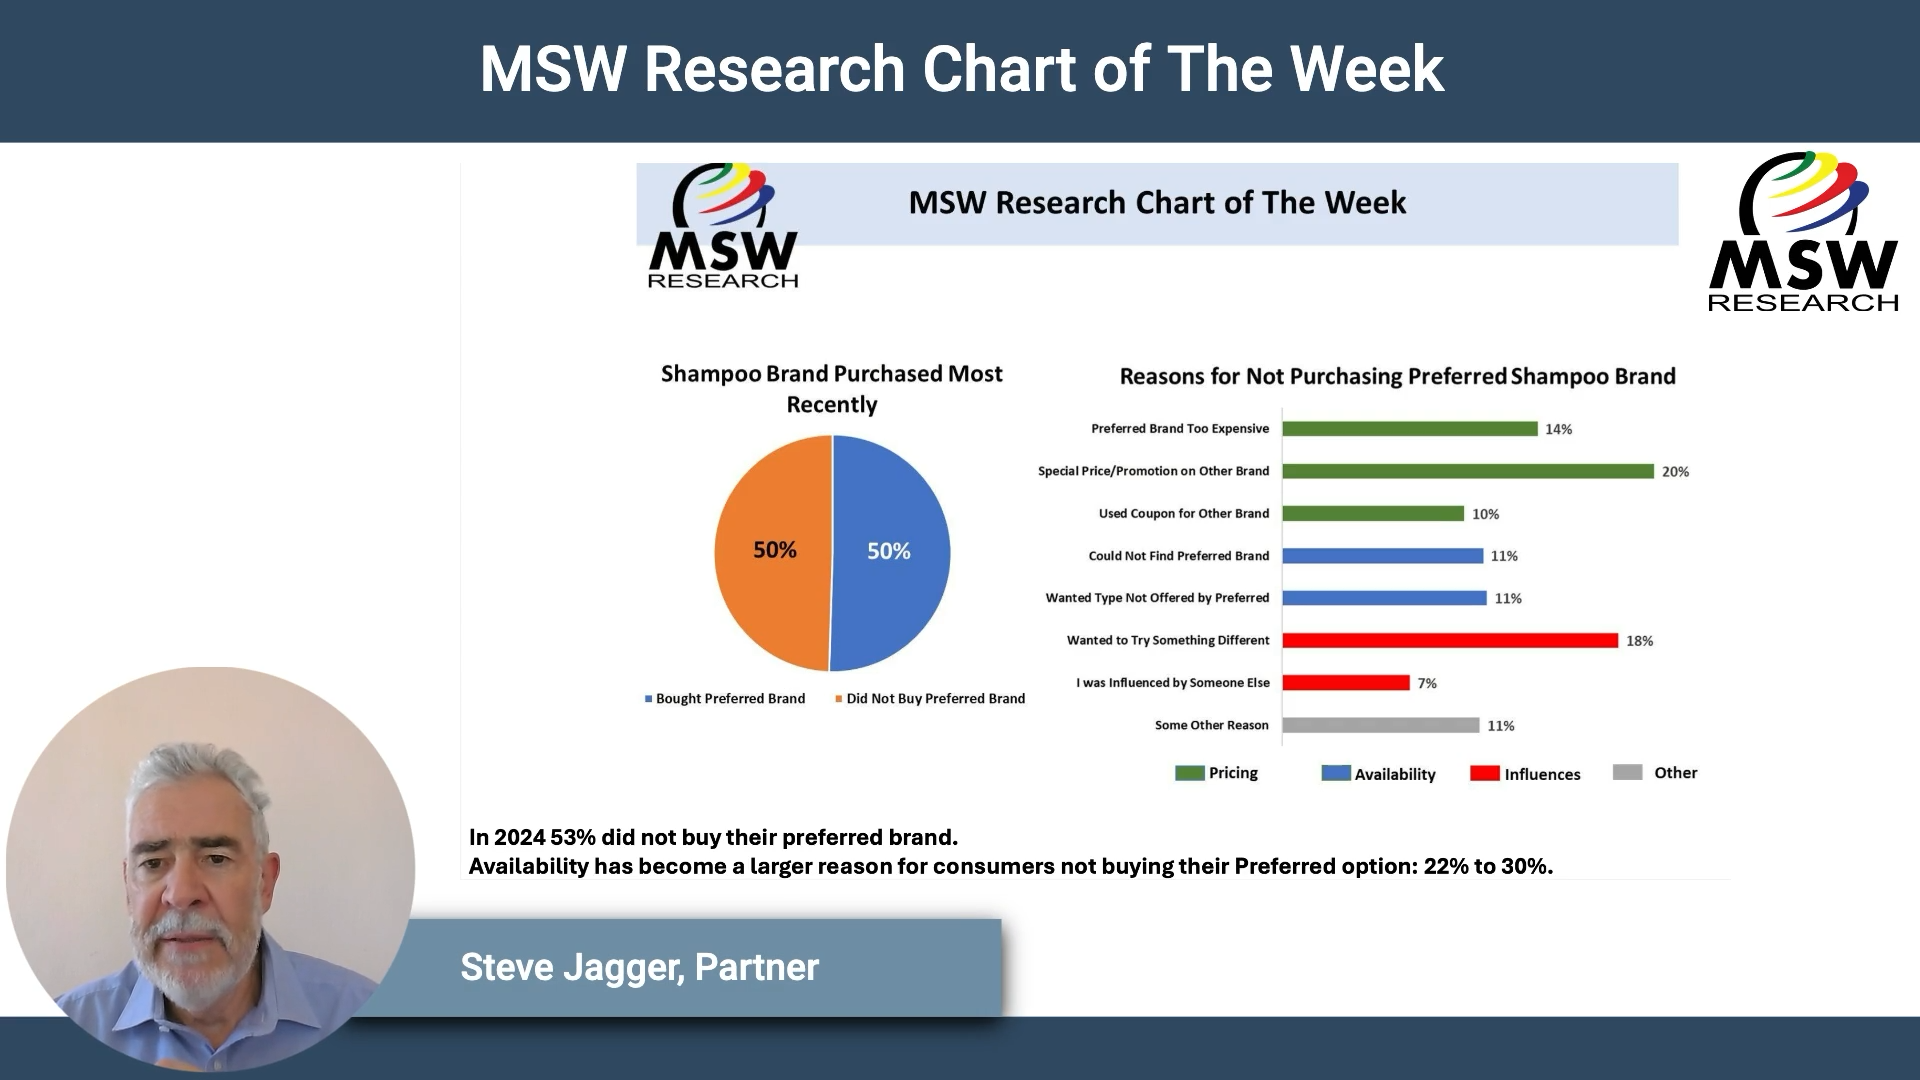
Last year, an MSW Research report had readers intrigued. We spotted an anomaly in the shampoo category: In 2023, 50% of consumers didn’t buy their preferred brand. This is unusual, you would normally expect 25-30% not buying their preferred brand. In 2024, instead of a return to normalcy, the figure rose even further. ⌖ The…
-
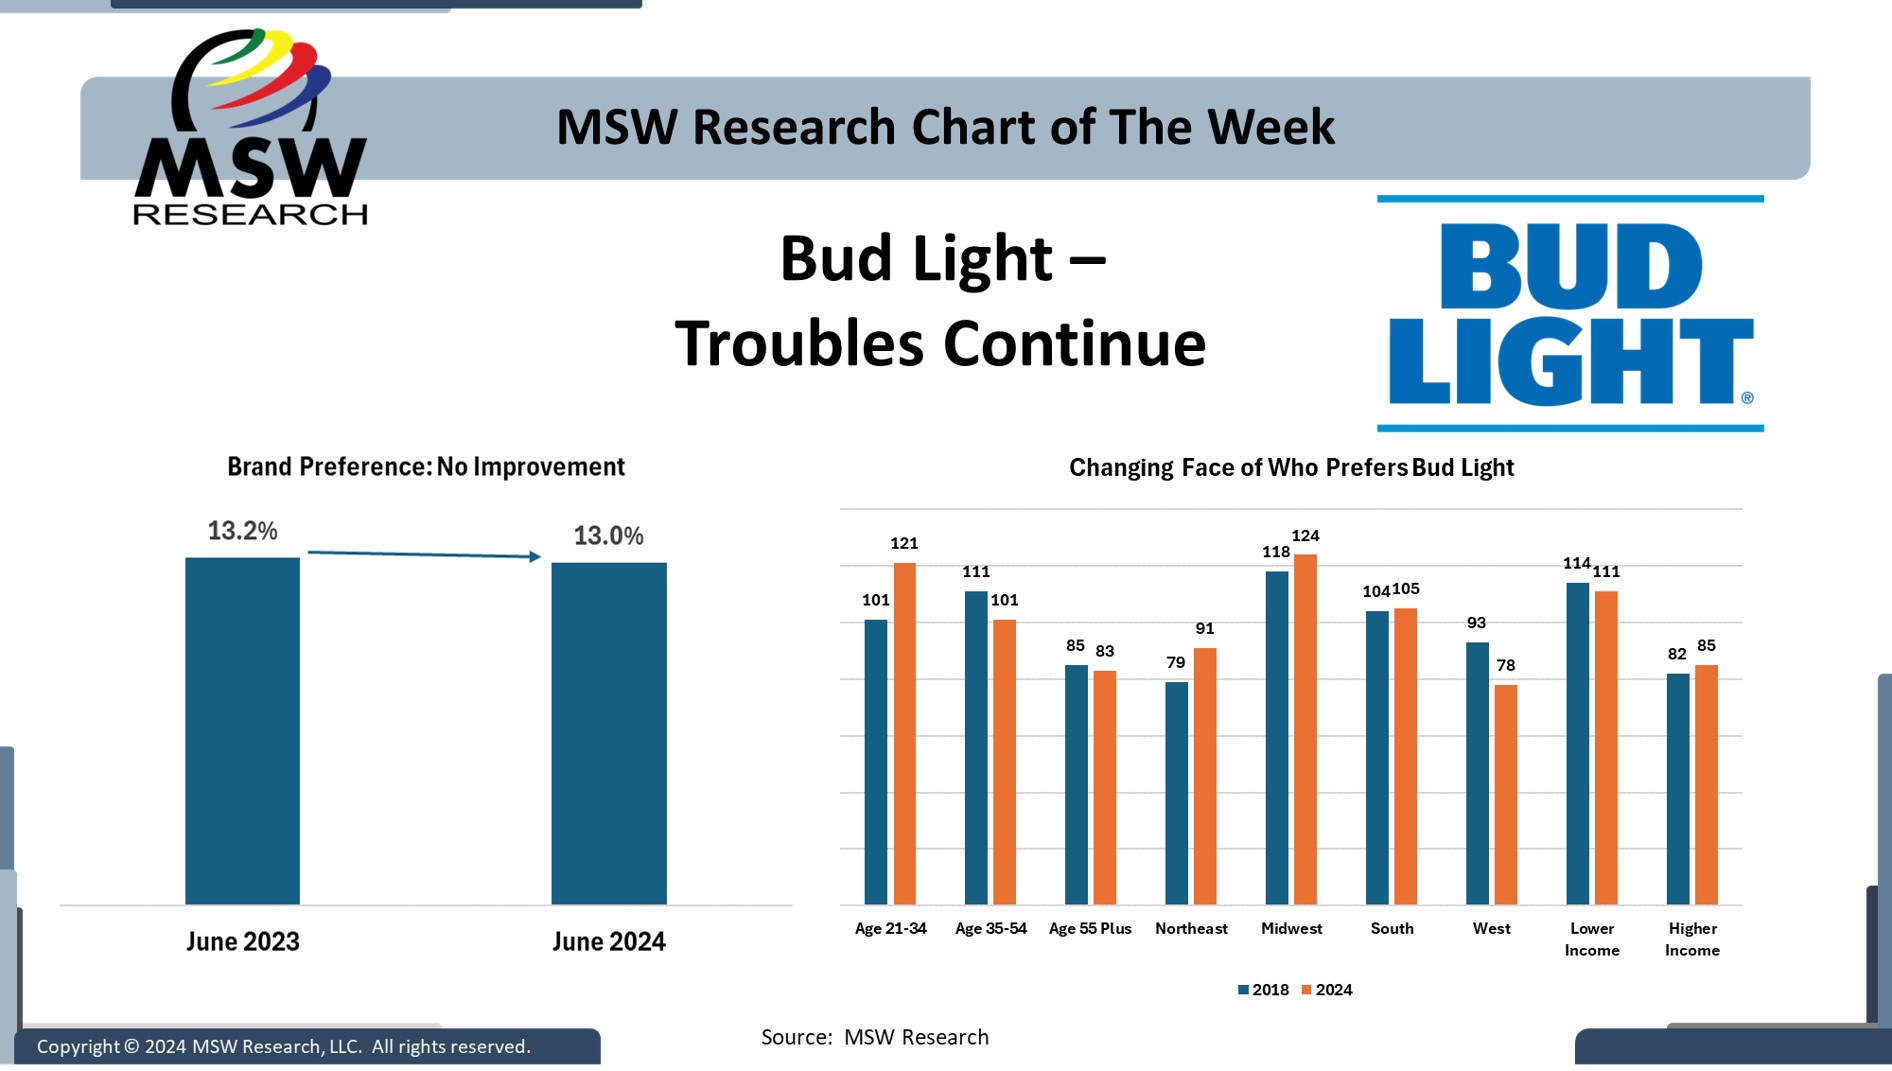
| Chart of The Week | Bud Light – Troubles Continue
In April of 2023, Bud Light beer ran a social media promotion featuring transgender personality Dylan Mulvaney. The video promoting Bud Light appeared on Mulvaney’s Instagram account and set in motion a boycott of the brand in the U.S. by conservatives, famously promoted by Kid Rock sharing a video of himself shooting up cases of…
-
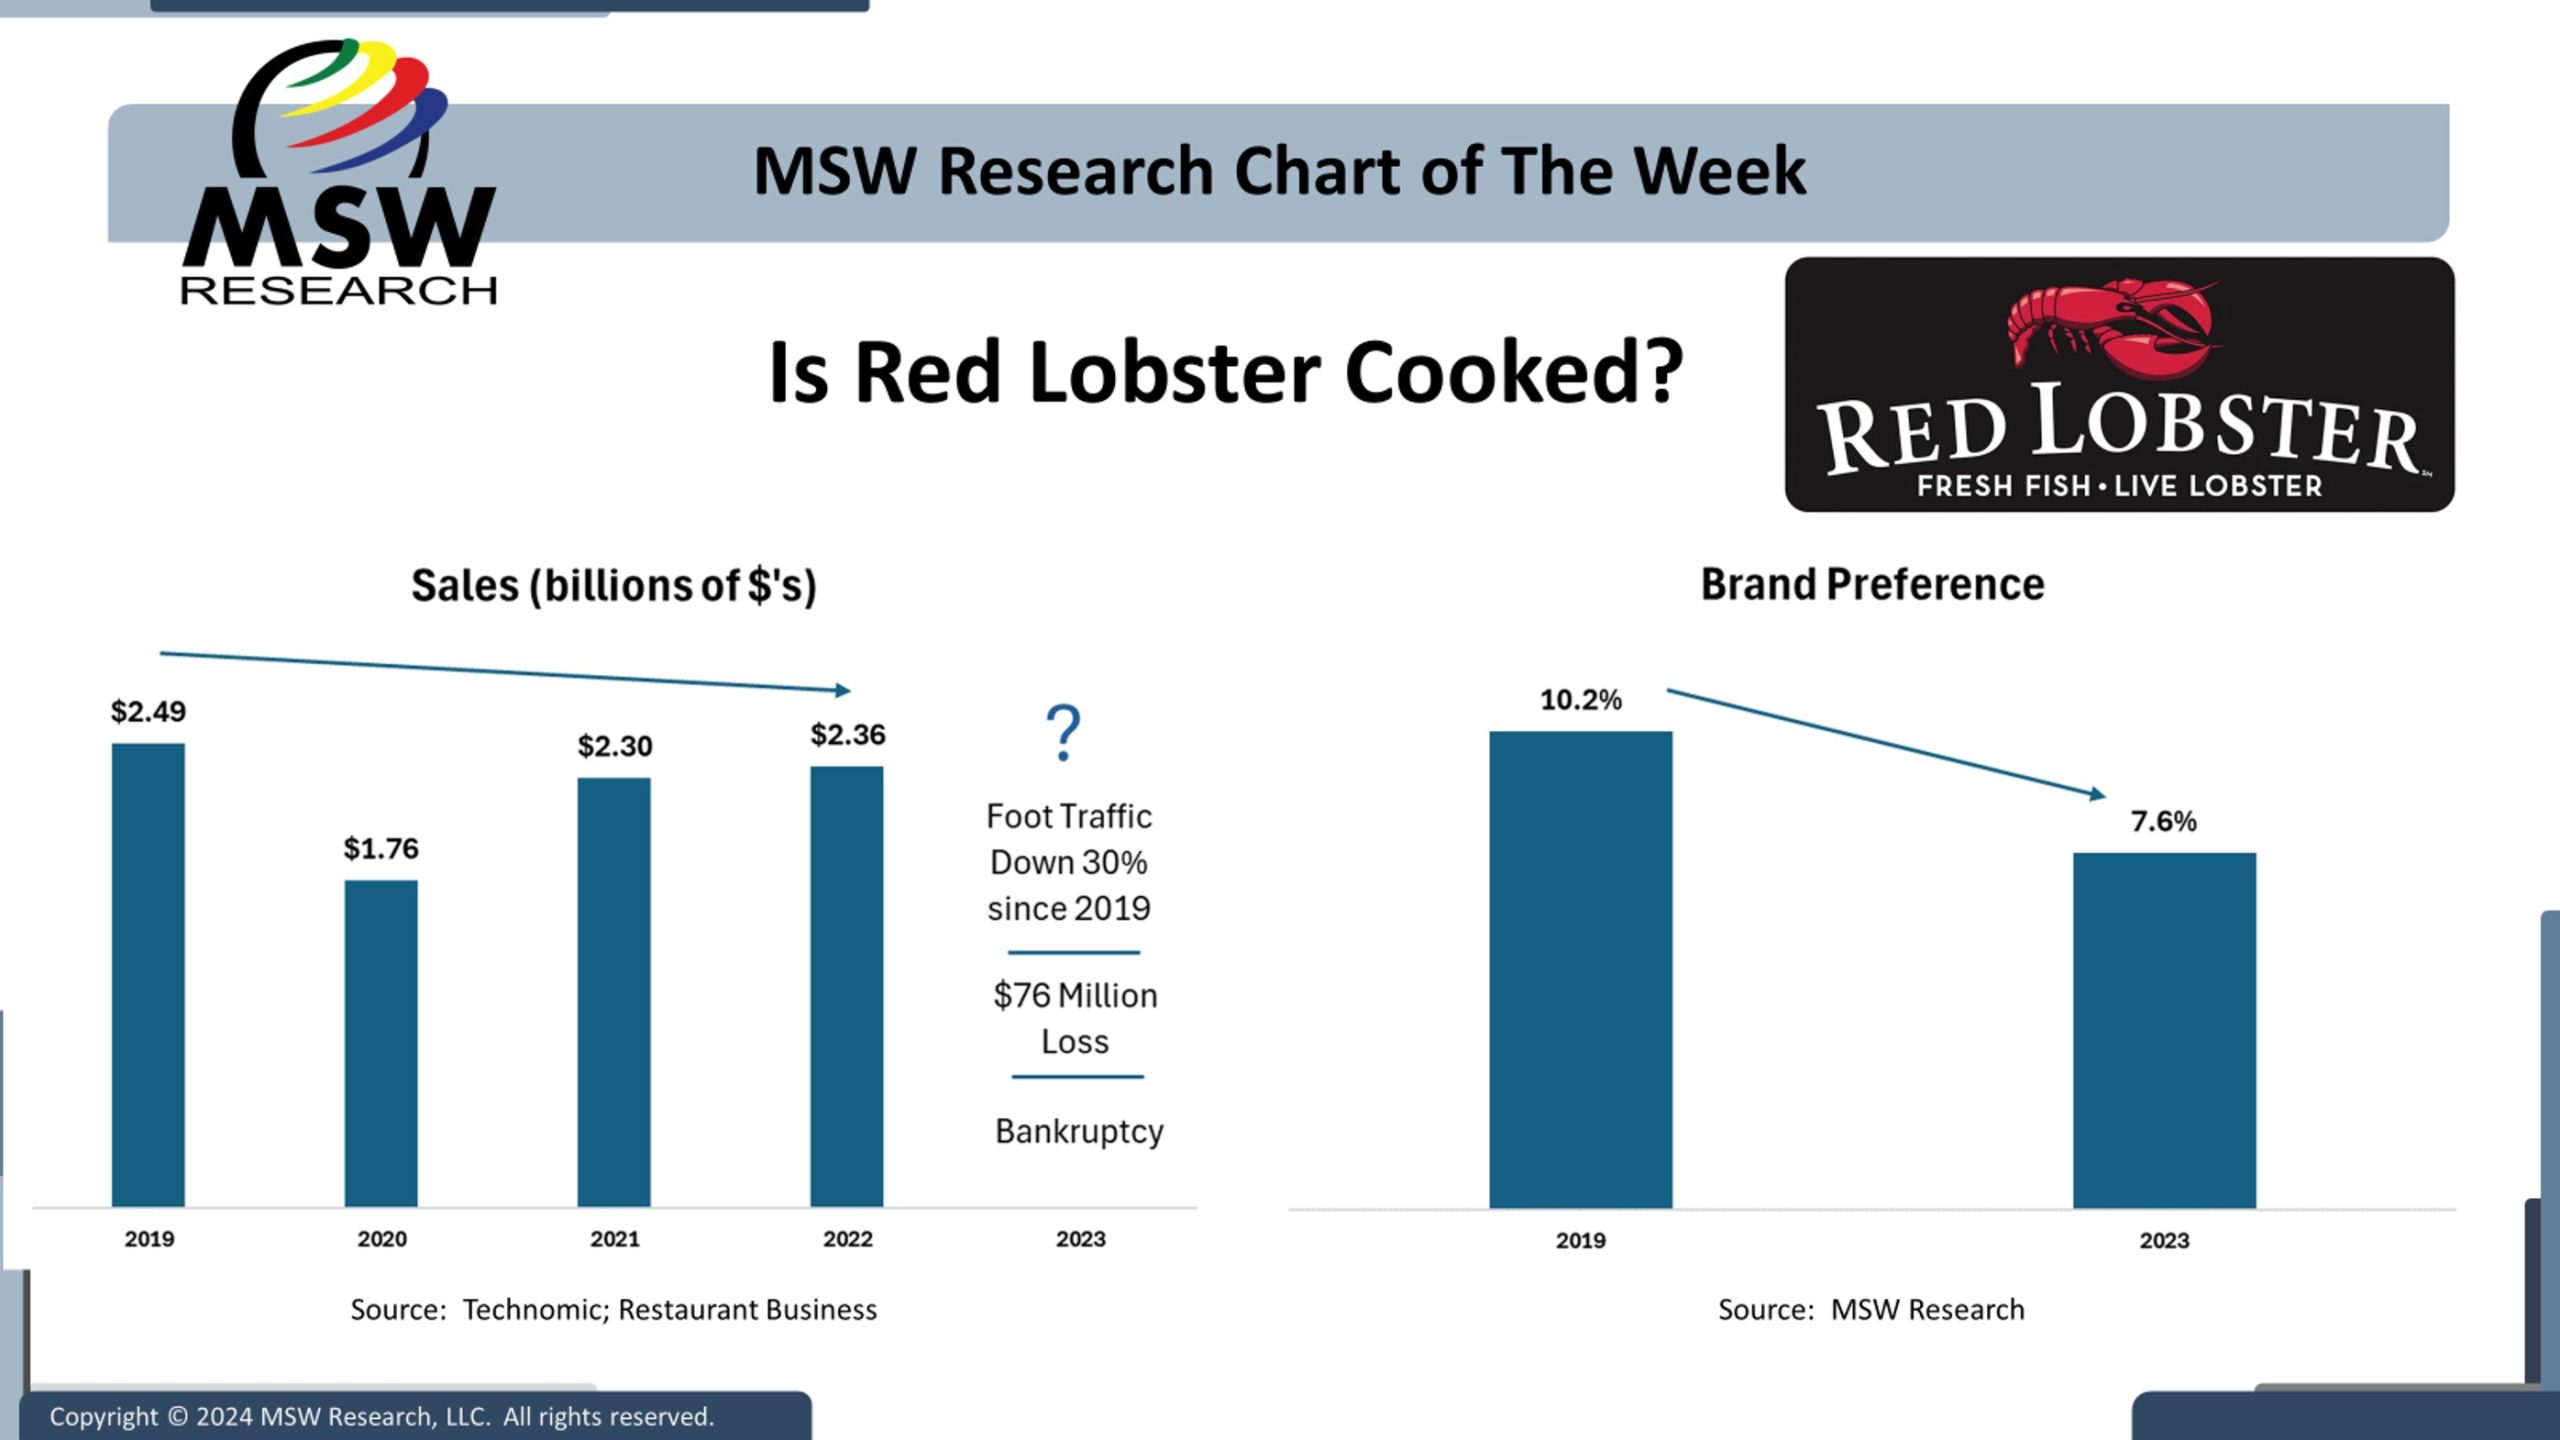
| Chart of The Week | Is Red Lobster Cooked? Yes, but there’s more to the story.
The MSW TBSM tracking service measures brand preference as one component of the survey. We collected Brand Preference data for the Casual Dining Restaurant category in both 2019 and 2023. Included in this competitive set is Red Lobster, which recently declared bankruptcy. This week’s MSW Research Chart of the Week looks at both Brand Preference…
-
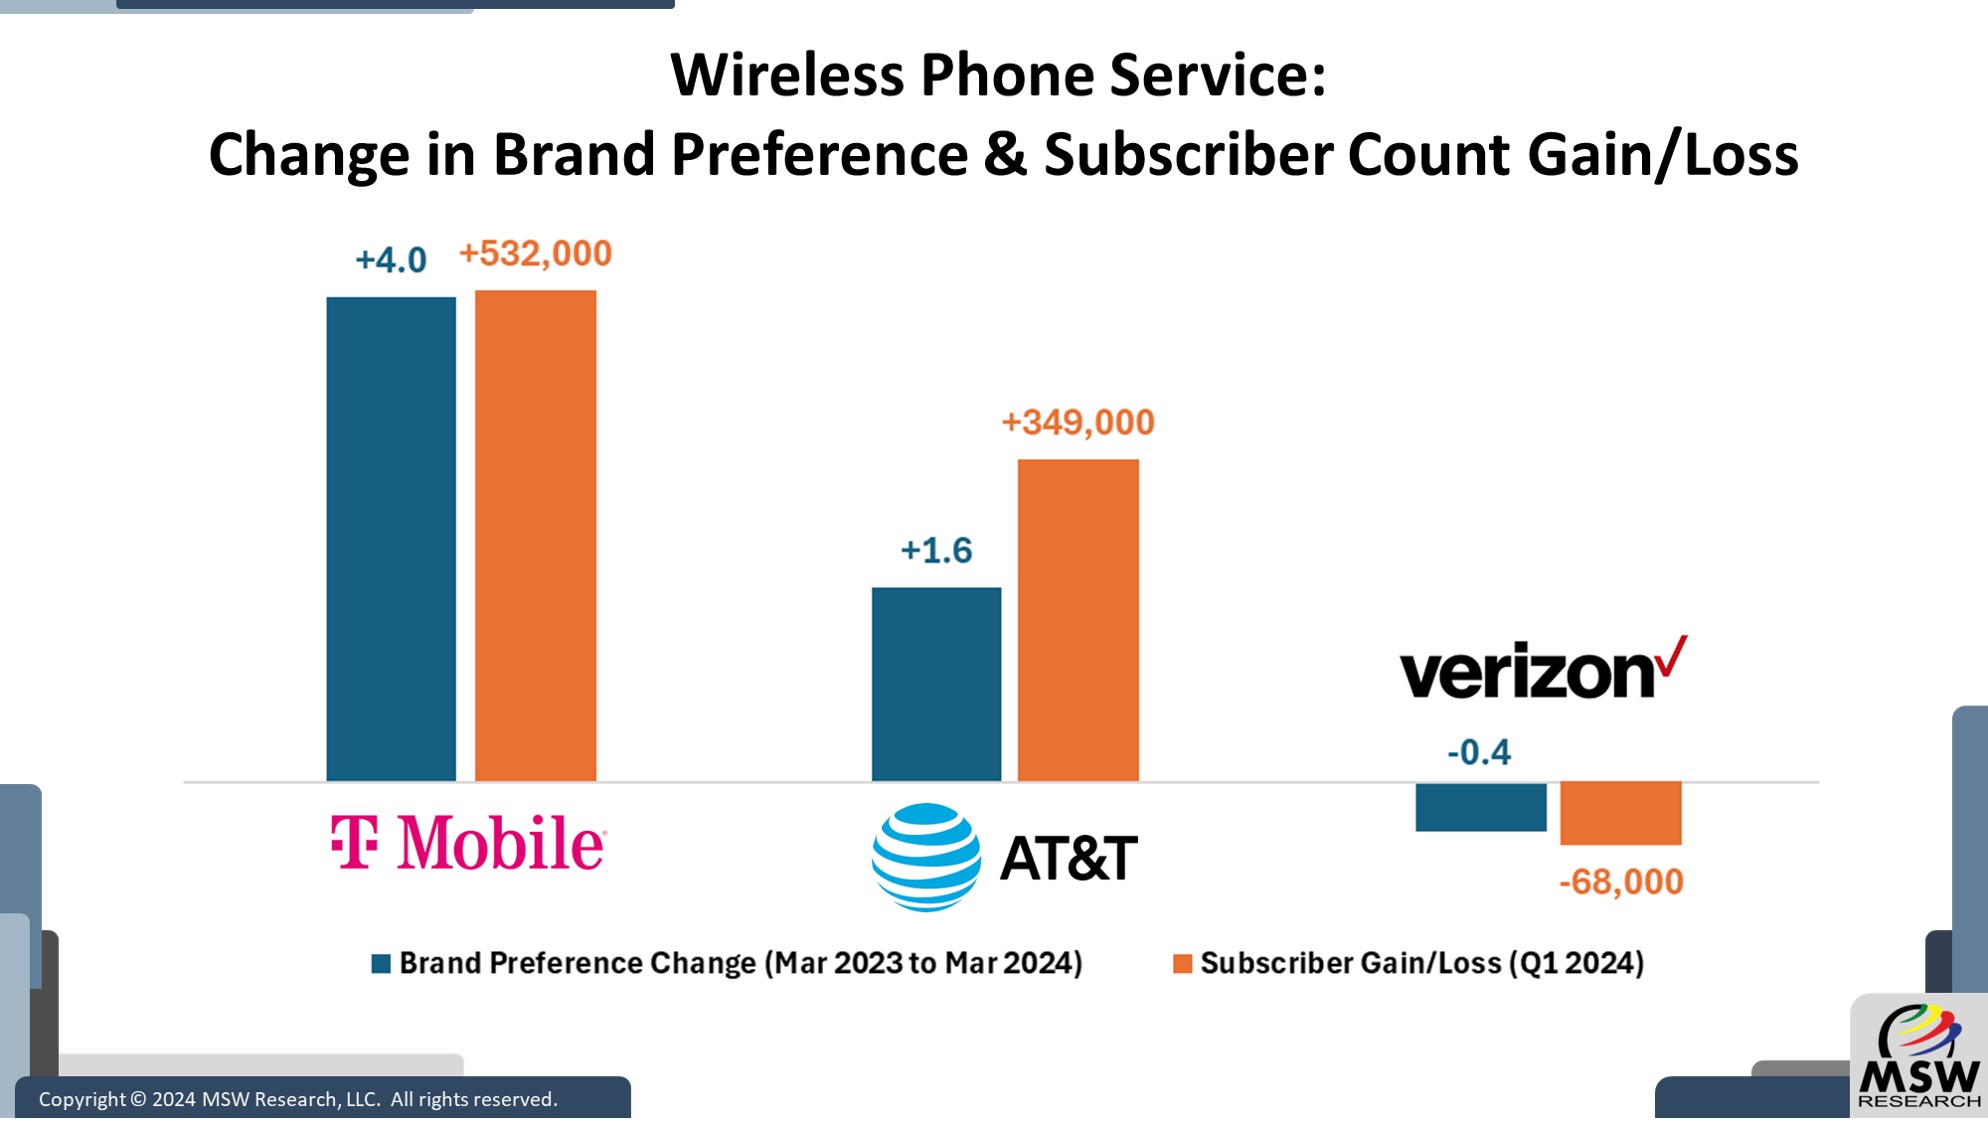
| Chart of The Week | Wireless Phone Service: Change in Brand Preference & Subscriber Count Gain/Loss
The MSW TBSM tracking service measures Brand Preference as one component of the survey. Wireless Phone Service category, changes in Brand Preference levels between March 2023 and March 2024 were computed for individual brands. Our Chart of the Week displays these results for the three top players in the U.S. Wireless Phone Service market: AT&T,…
-
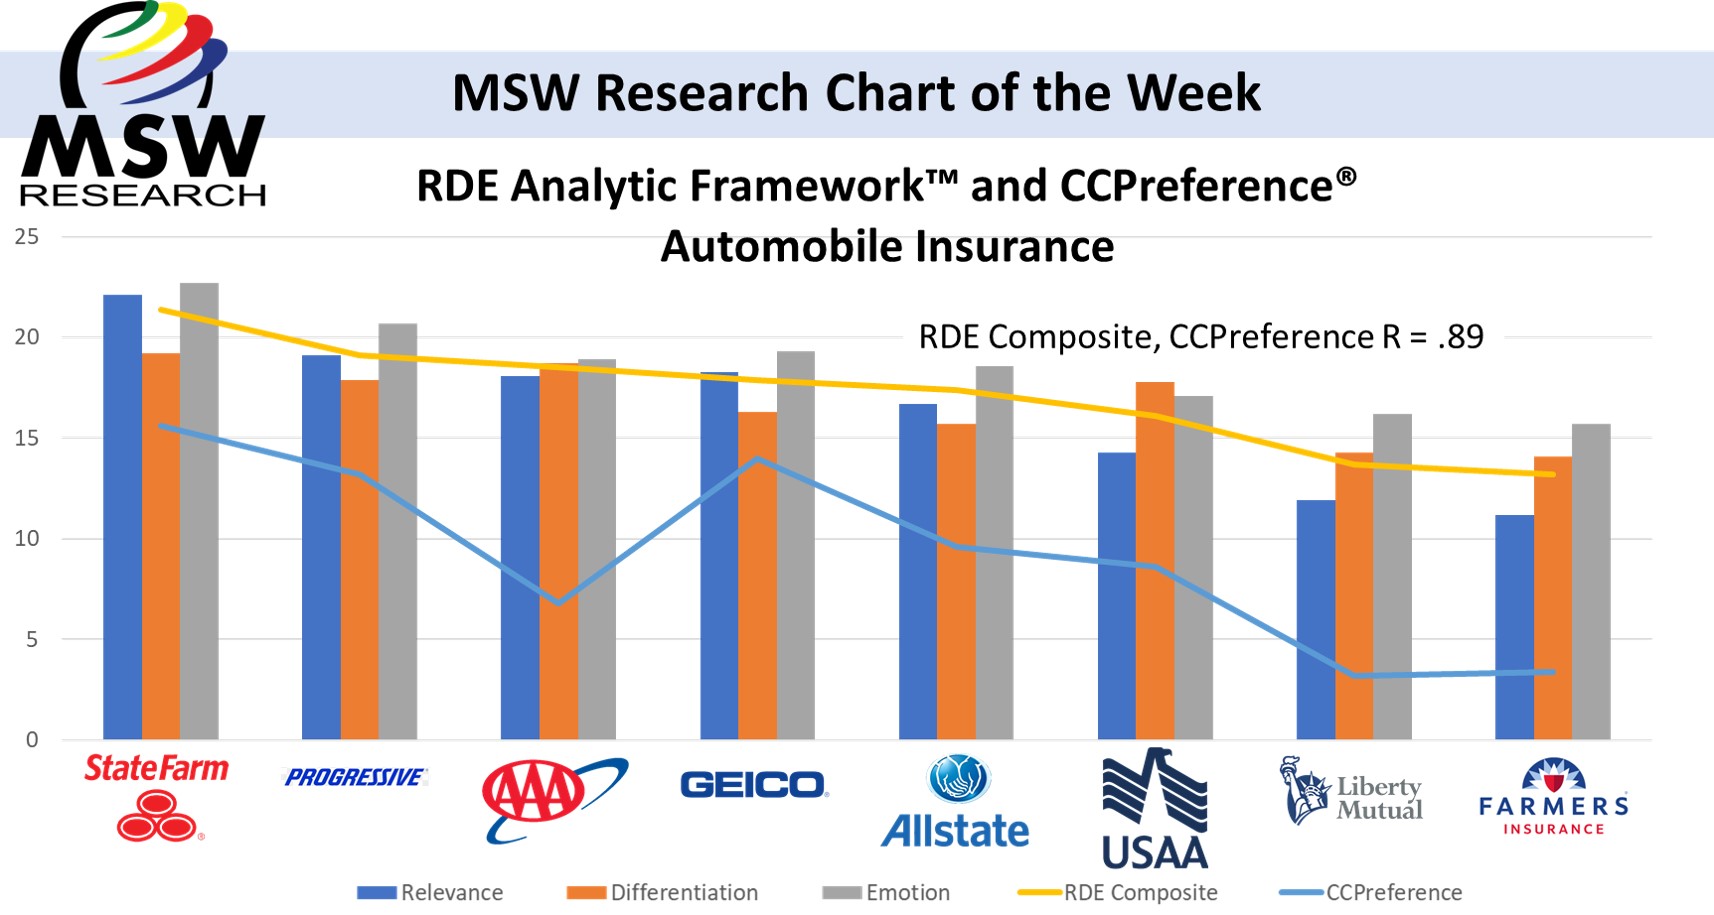
| Chart of The Week | Automobile Insurance: Change in Brand Preference and Share 2021 vs 2023
The MSW TBSM tracking service measures brand preference as one component of the survey. Using TBSM Auto Insurance category data, changes in brand preference results between 2021 and 2023 were computed for individual brands. Our Chart of the Week displays these results for the three top players in the US Auto Insurance market: State Farm,…
-
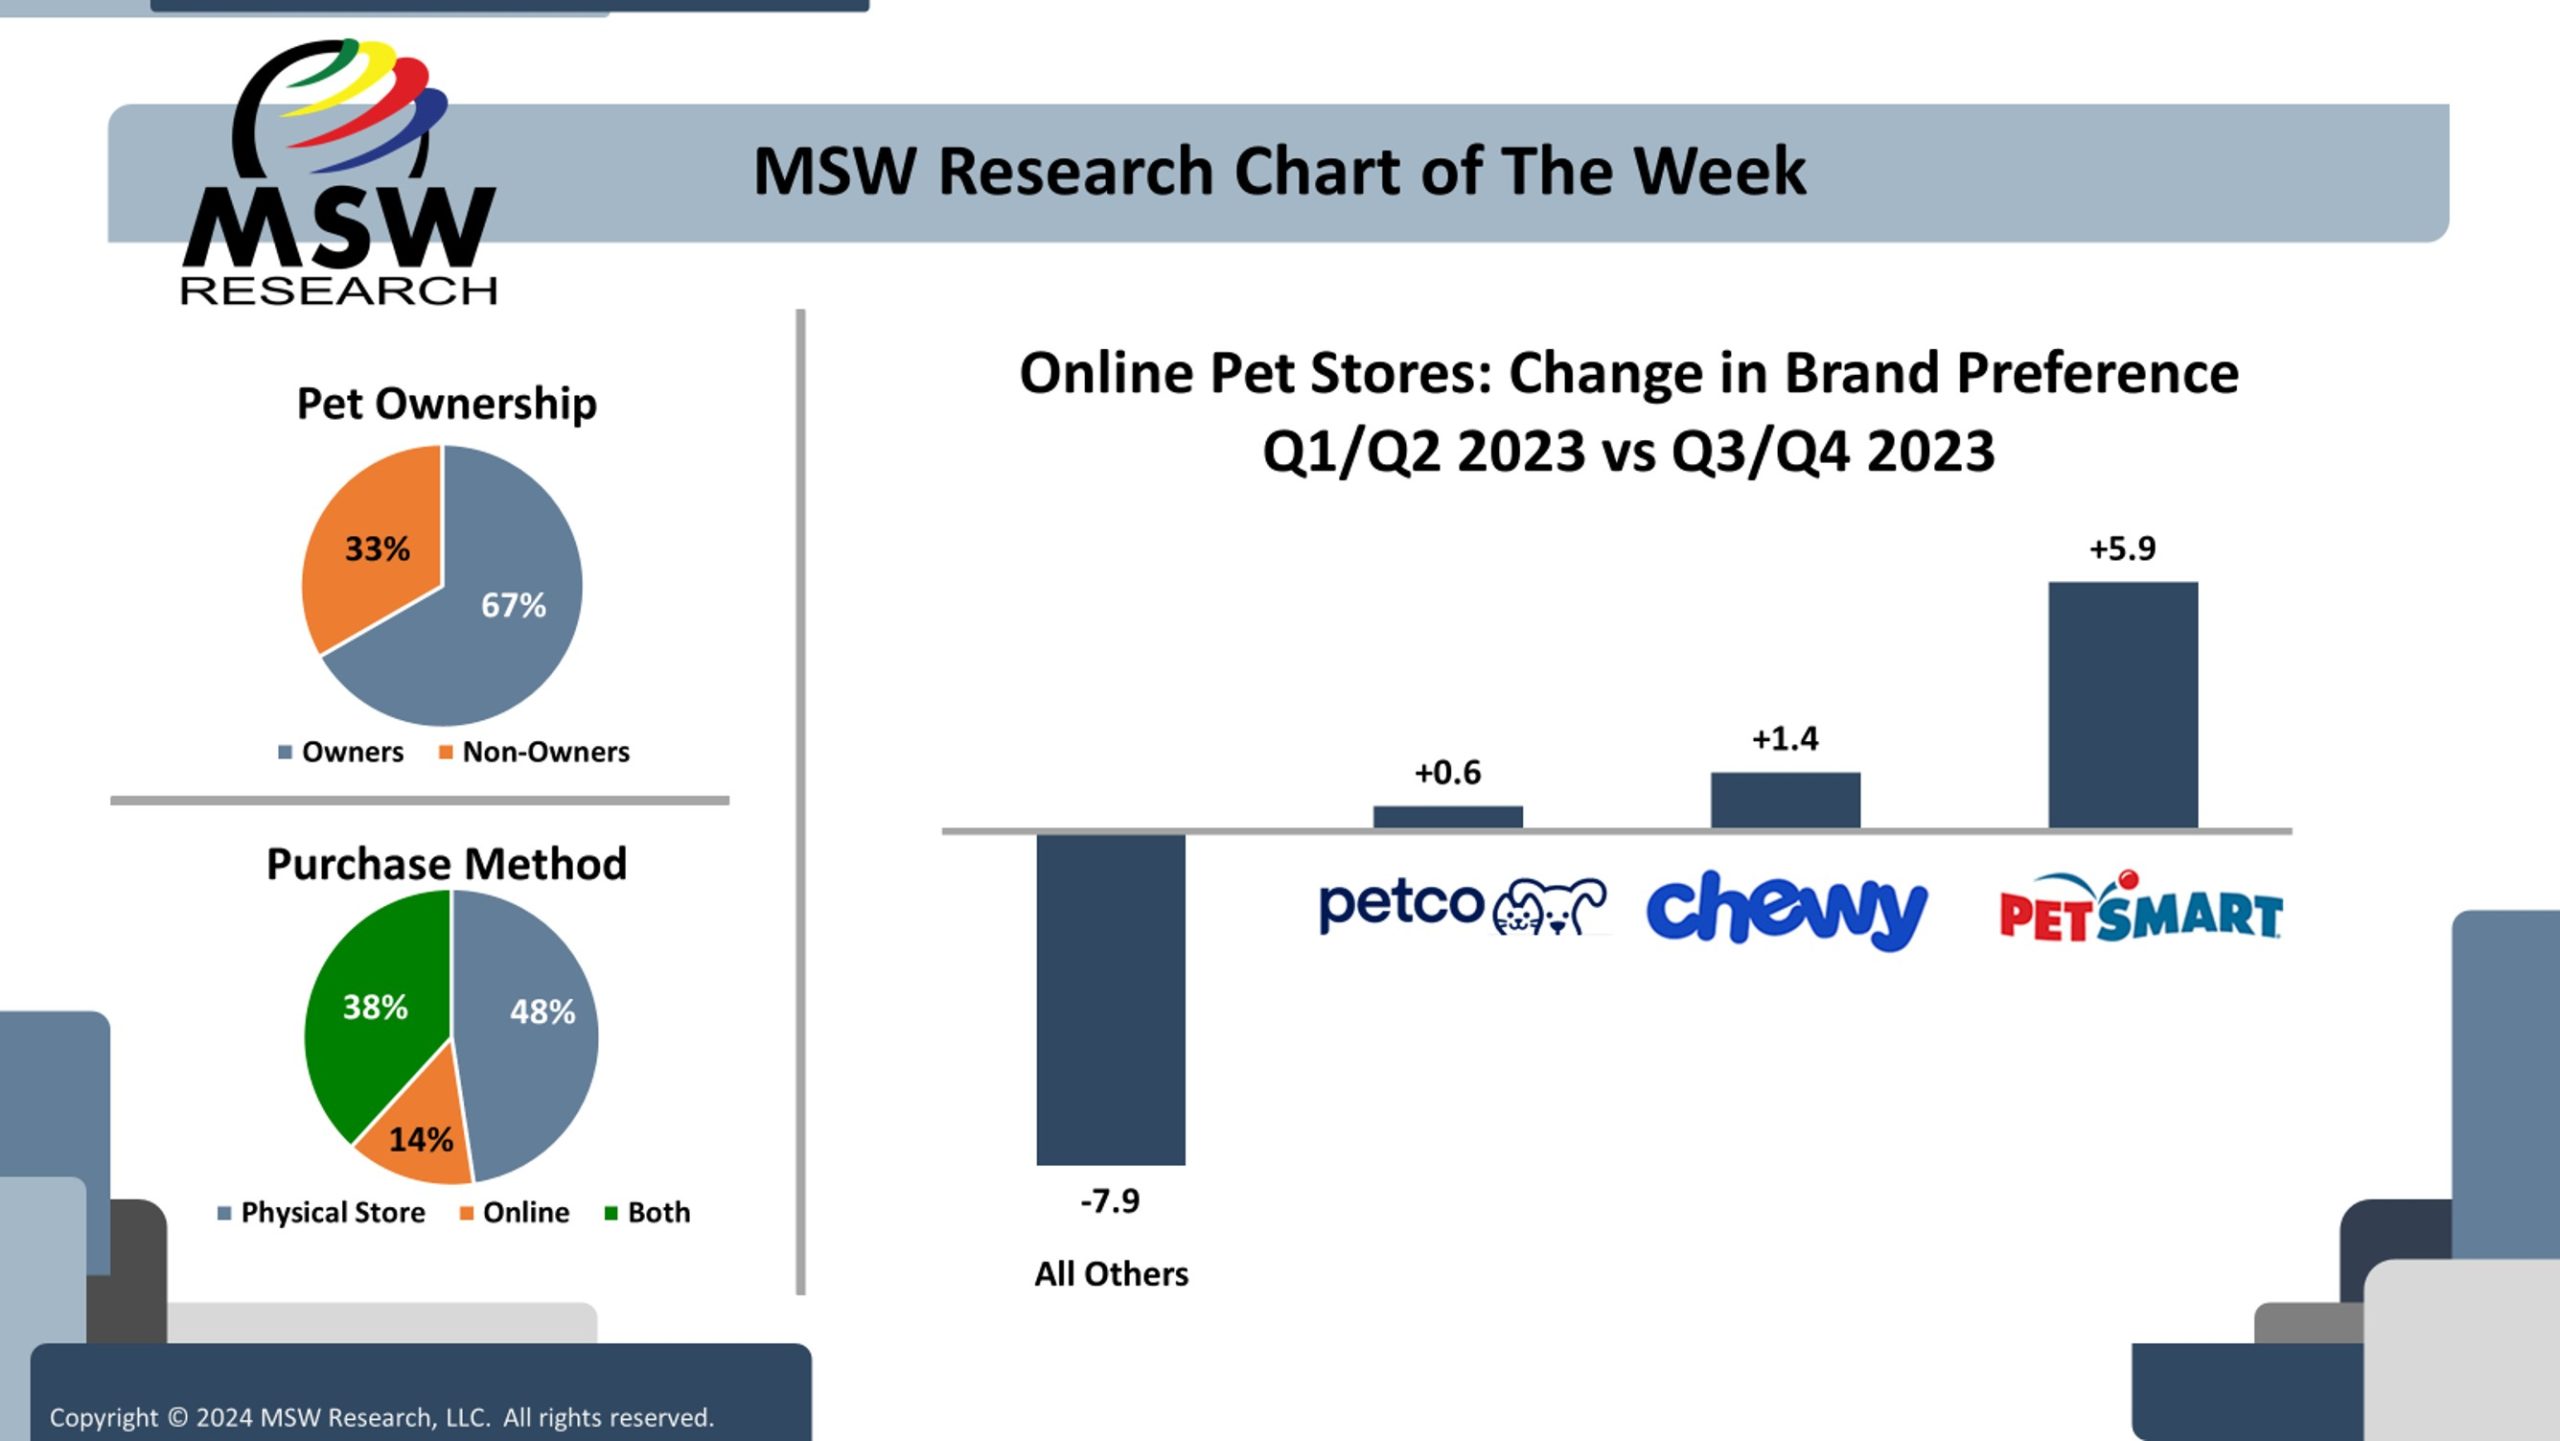
| Chart of The Week | Online Pet Stores
The MSW TBSM tracking service measures brand preference as one component of the survey. Brand preference was collected quarterly for eleven major Online Pet Store brands during 2023 (among 500 respondents each quarter). This week’s chart examines the changes in brand preference from the first half to the second half of 2023 for the three…
-
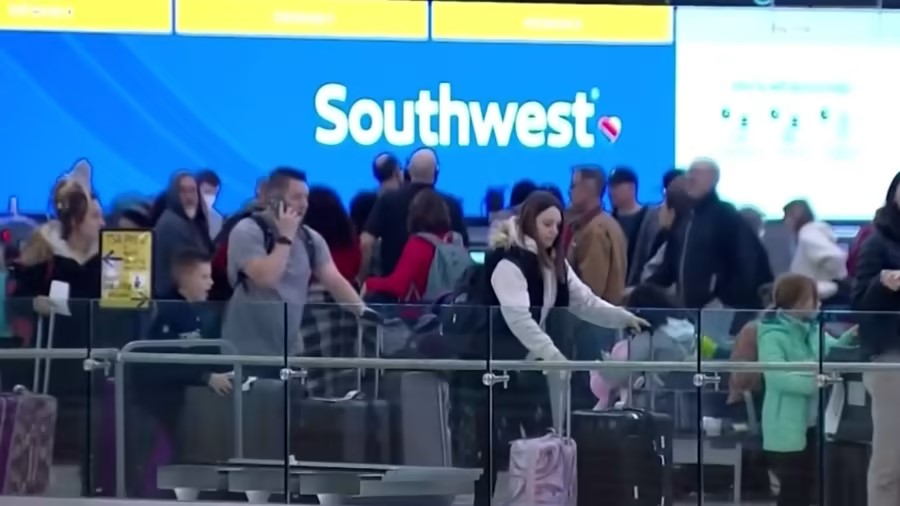
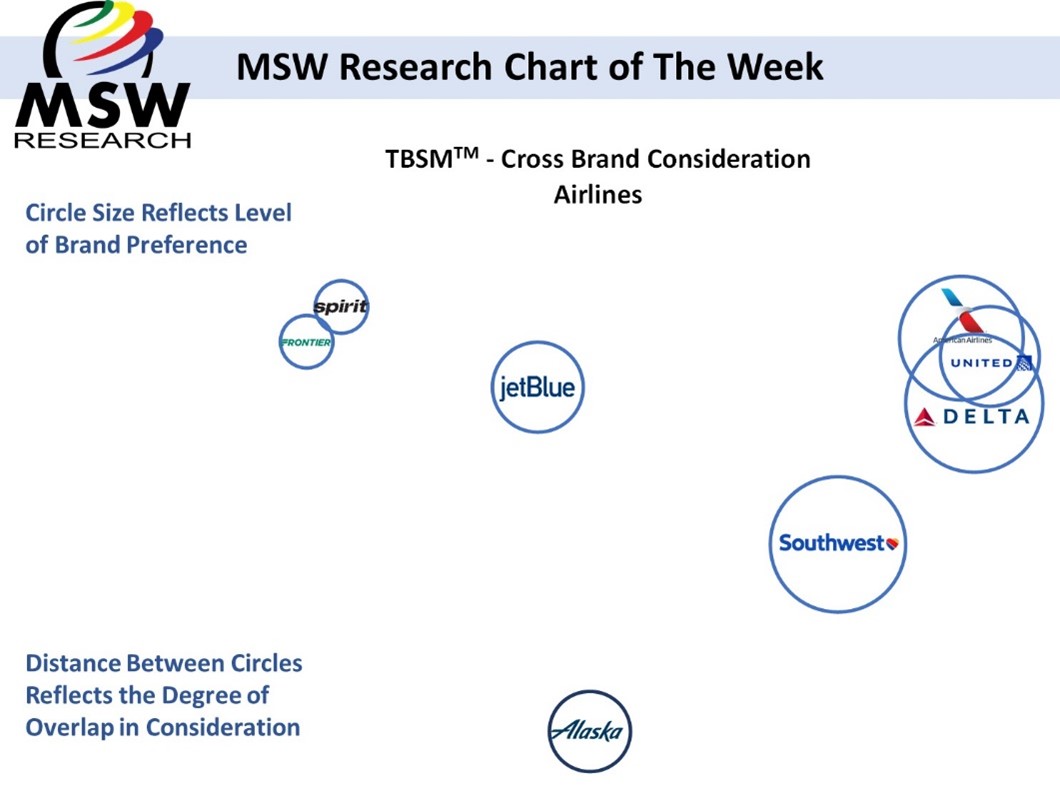
Impact of Turmoil in the Airline Industry: 2022 to 2023
The airline industry has been going through a difficult time; COVID shutdowns, Staff shortages, Inflation, weather and FAA system outages. Some airlines tried to recover from COVID too quickly and have then had to rollback planned/scheduled expansions. The result is misery for passengers, who can expect long lines, packed flights, less space on board and…
-
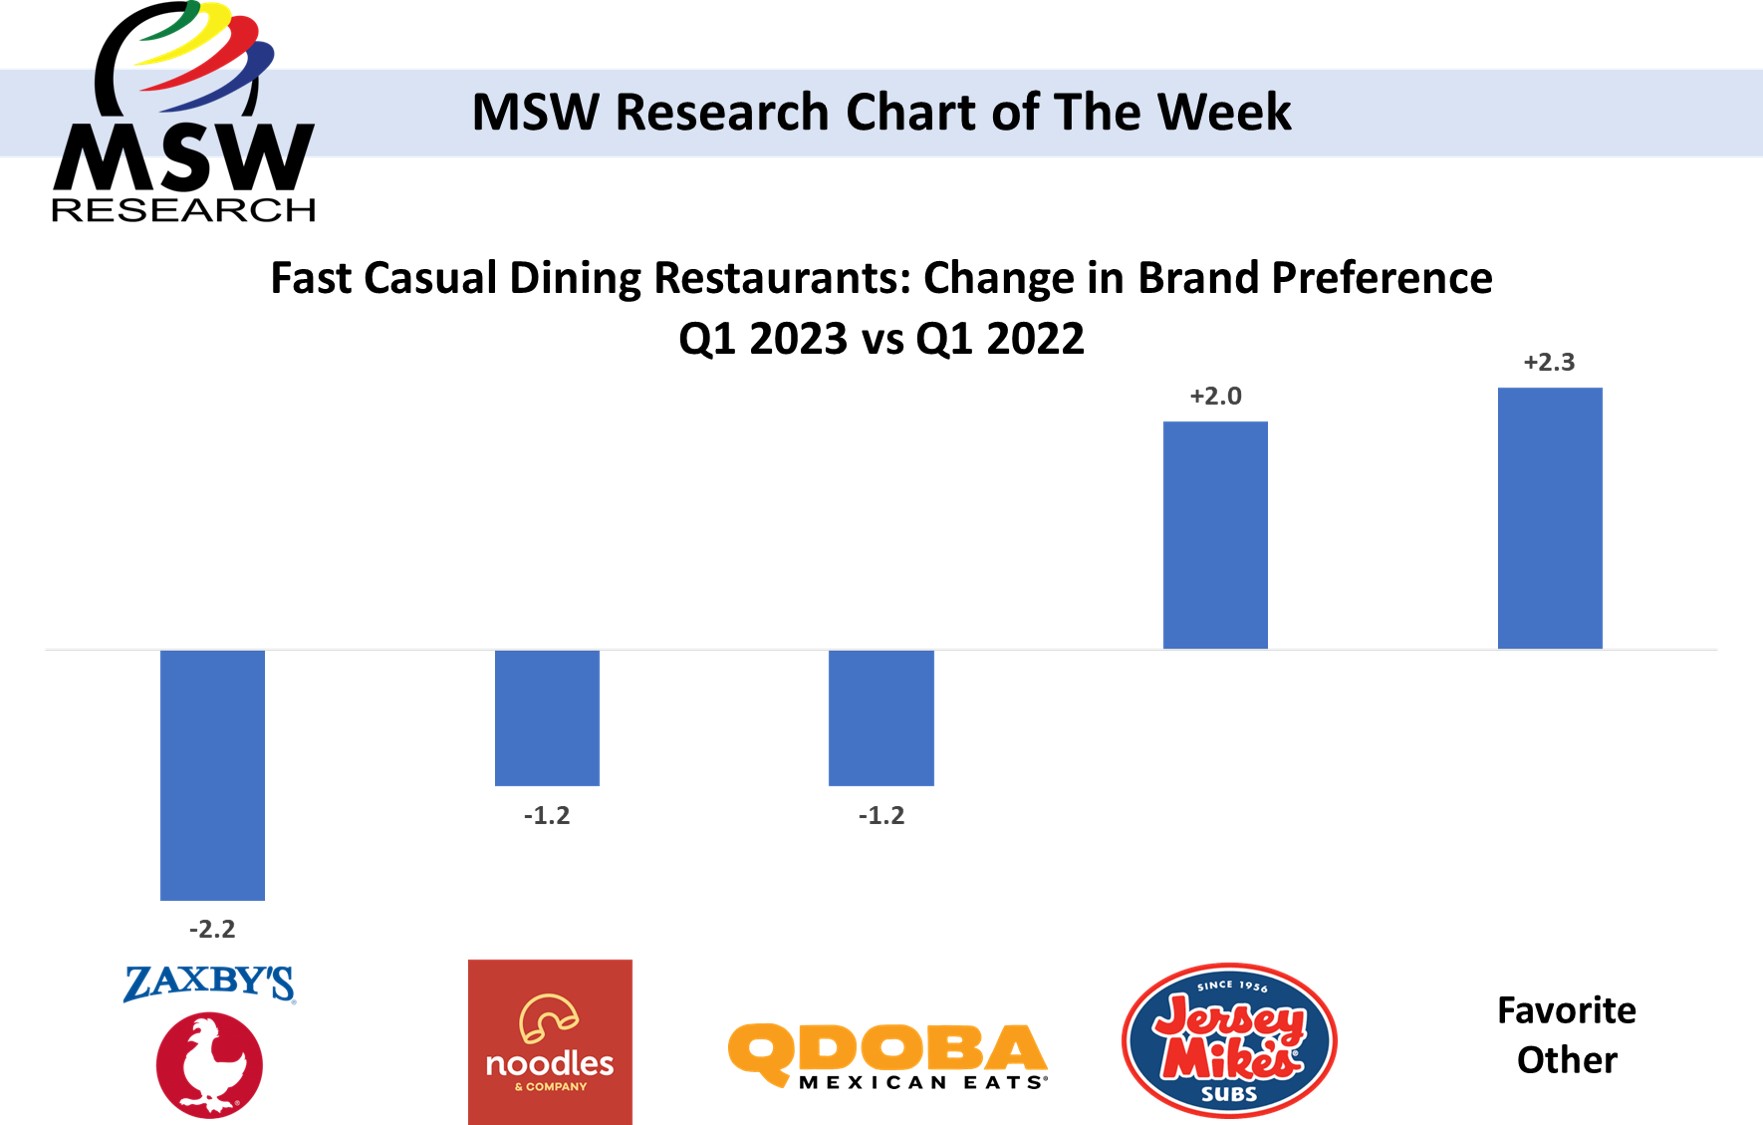
| Chart of The Week | Fast Casual Dining Restaurants: Change in Brand Preference
The MSW TBSM tracking service measures Brand Preference as one component of the survey. Brand Preference was collected for approximately twenty major Fast Casual Restaurant brands in both Q1 2022 (among 1000 demographically and geographically balanced respondents) and Q1 2023 (among 500 similarly balanced respondents). This week’s chart examines the five fast casual options that…
-
TBSM Chart of the Week 2022 Review
The MSW TBSM tracking service collects a variety of metrics across a wide range of categories. Throughout 2022, we published Charts of the Week using data drawn from the TBSM survey. Six different categories and multiple measures within each category have been explored. The categories were: • Subscription Streaming Video Services • Cryptocurrency Exchanges •…