Category: Chart of The Week
-
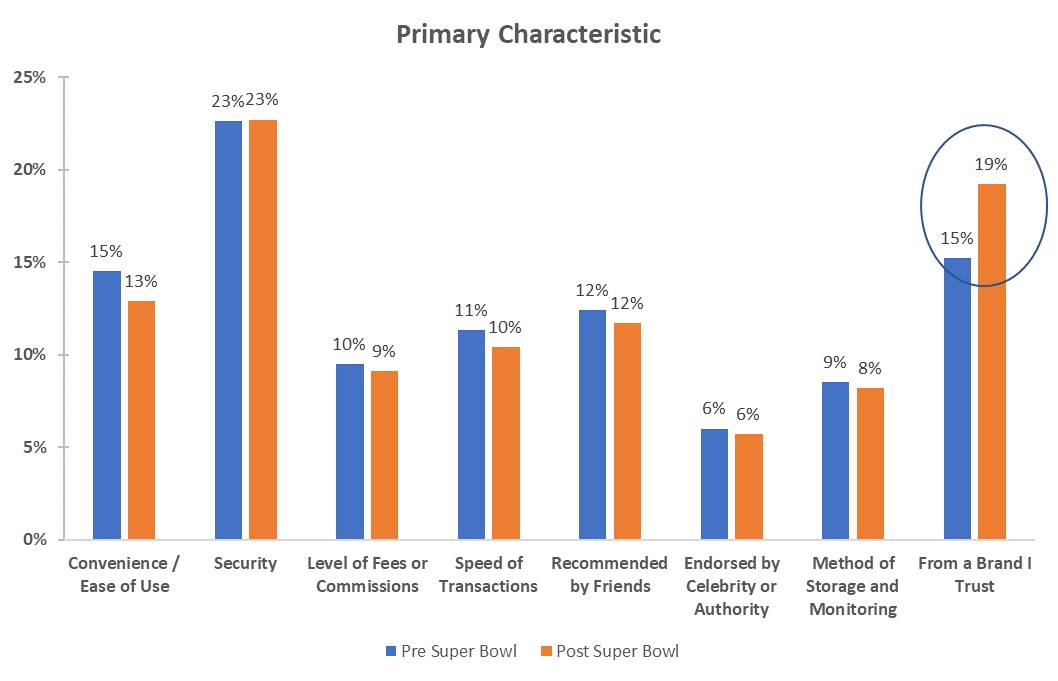
The Crypto Bowl: How Crypto Exchange Super Bowl Ads Affected Awareness and Brand Preference
As usual, there was almost as much hype about the ads in the Super Bowl this year as there was about the game itself. And one of the advertising storylines this year centered around Cryptocurrency Exchange ads. This represented a coming-out party for Crypto Exchanges on the year’s biggest advertising stage. While the four Crypto…
-
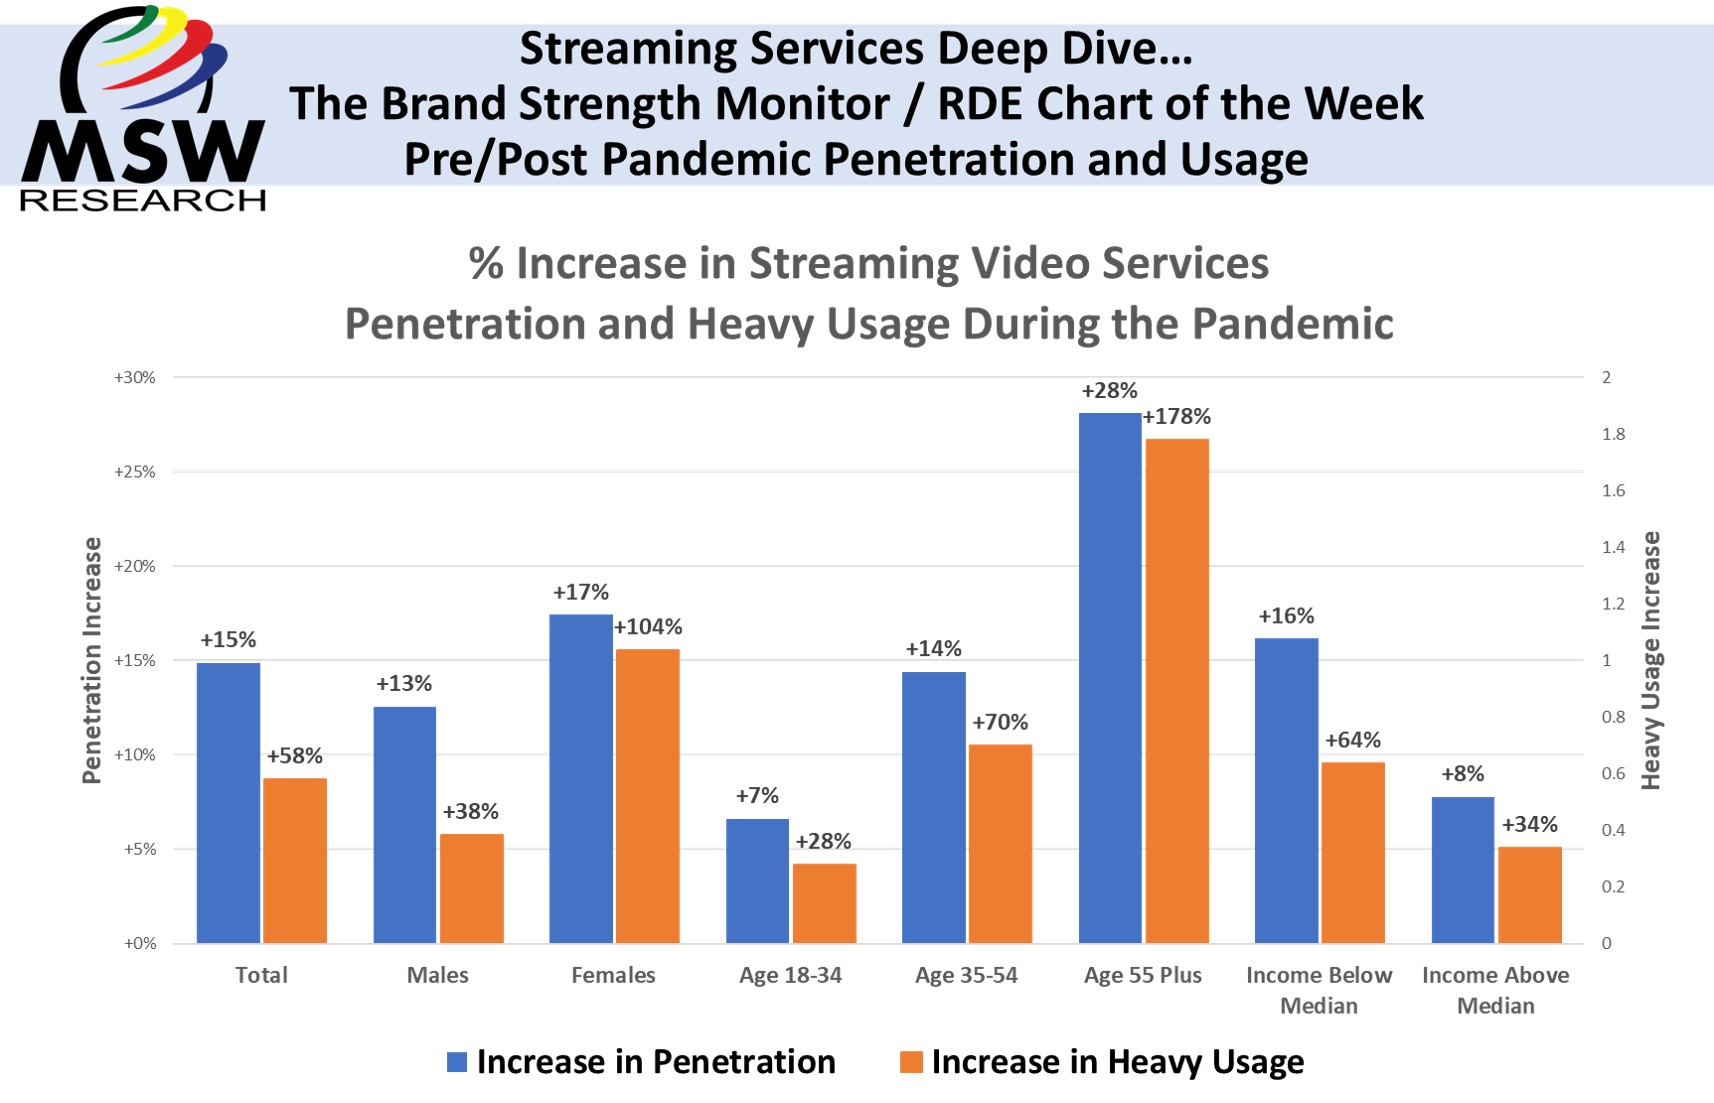
Streaming Services Deep Dive… | The Brand Strength Monitor / RDE Chart of the Week | Pre/Post Pandemic Penetration and Usage
In our last Chart of the Week we started looking at the Subscription Video Streaming Services category and specifically the pandemic winner – HBO Max. This week we’re taking a deep dive and examining the Pre/Post Pandemic Penetration and Usage by demographics. The MSW TBSM tracking service measures category penetration and level of usage as…
-
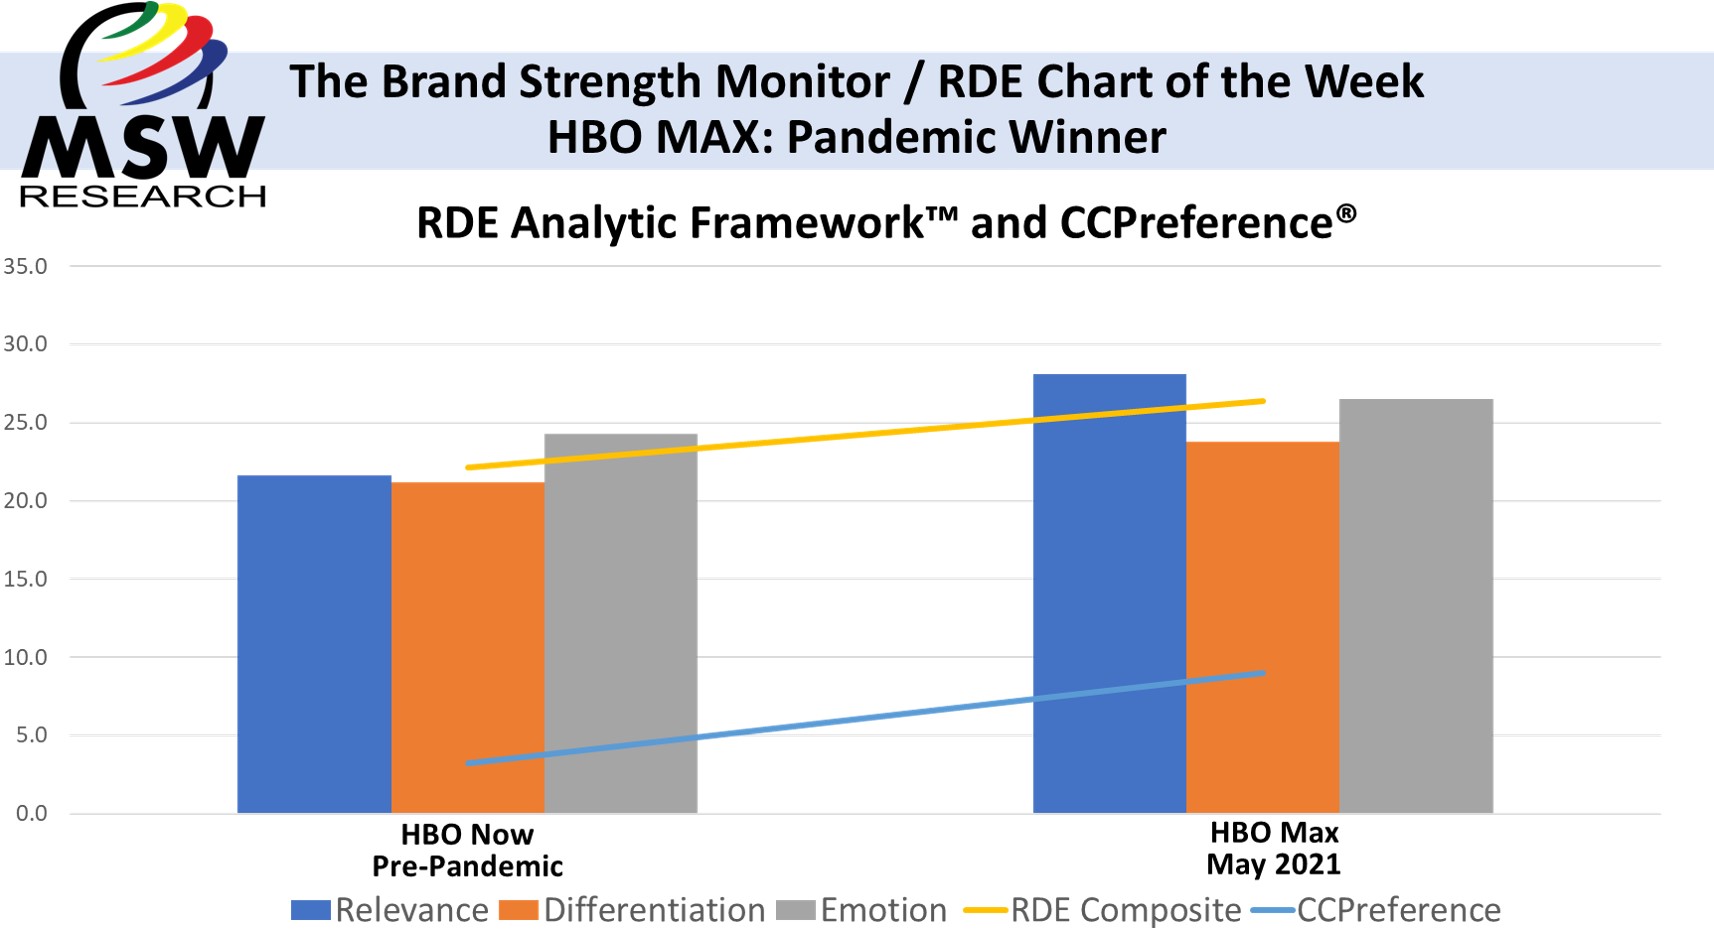
| The Brand Strength Monitor / RDE Chart of the Week | HBO MAX: Pandemic Winner
MSW’s RDE Analytic Framework rests on a study that found that three equity dimensions (Relevance, Differentiation, Emotion) are responsible for driving a significant portion of brand growth. The RDE composite strongly relates to – and helps explain – CCPreference which itself is a validated predictor of market share. Comparing RDE Assessment taken before the pandemic…
-
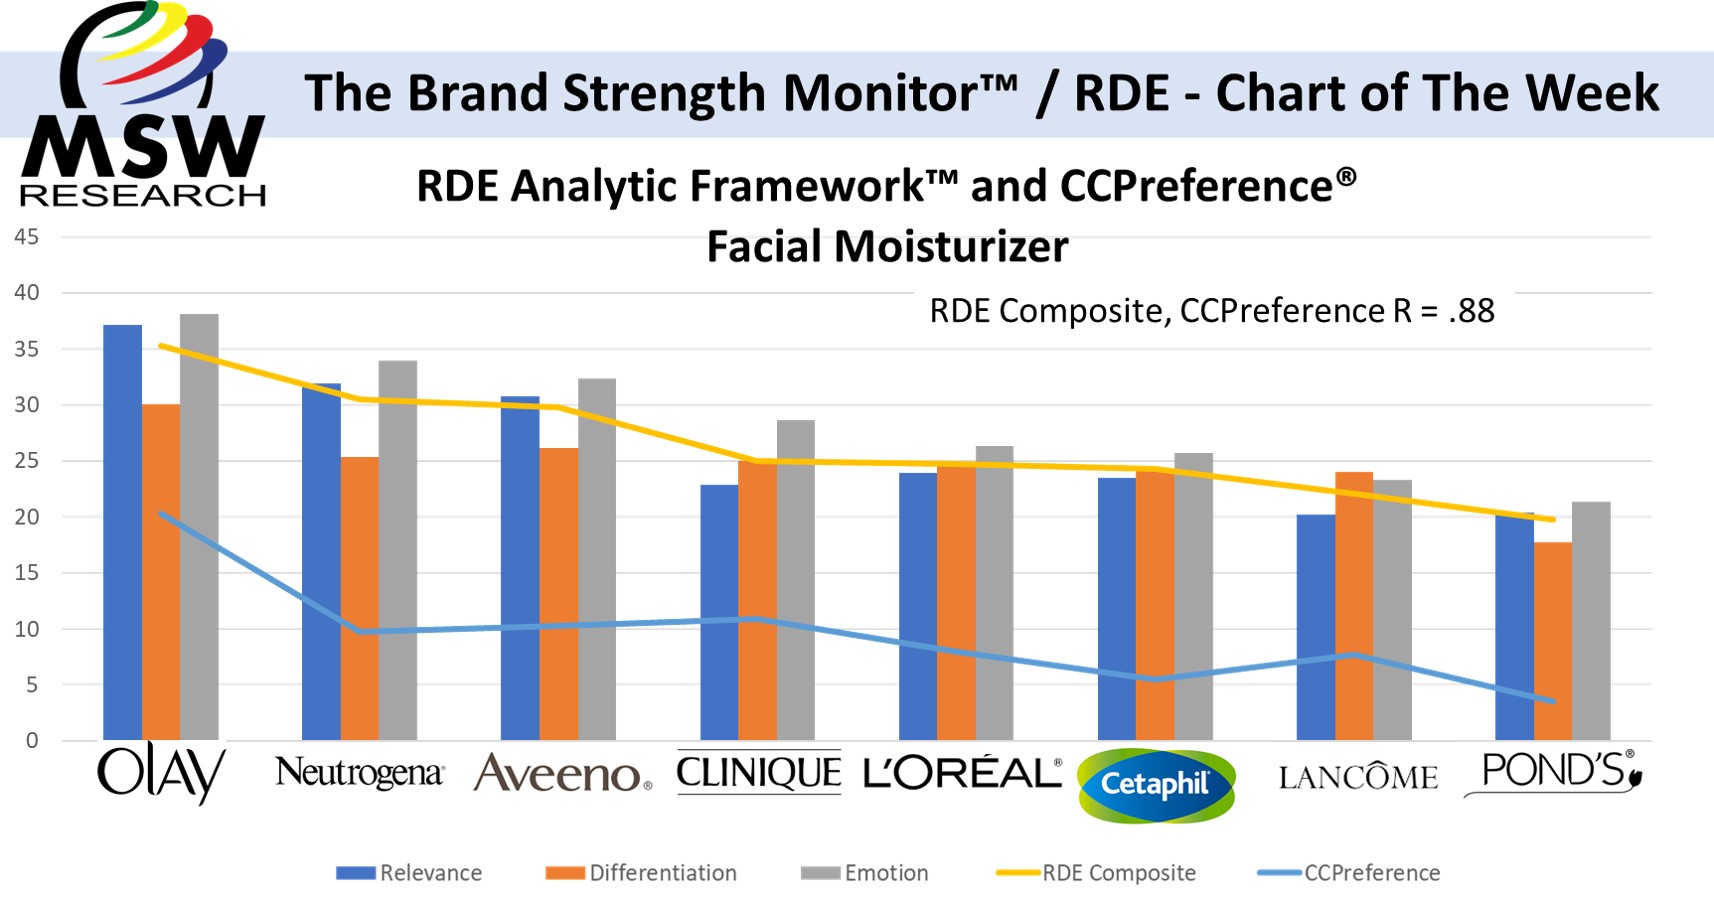
| The Brand Strength Monitor / RDE – Chart of the Week | Facial Moisturizer
MSW’s RDE Analytic Framework rests on a study that found that three equity dimensions (Relevance, Differentiation, Emotion) are responsible for driving a significant portion of brand growth. Our ongoing Chart of the Week series is dedicated to sharing RDE results for a variety of categories. If you have questions about your category or want…
-
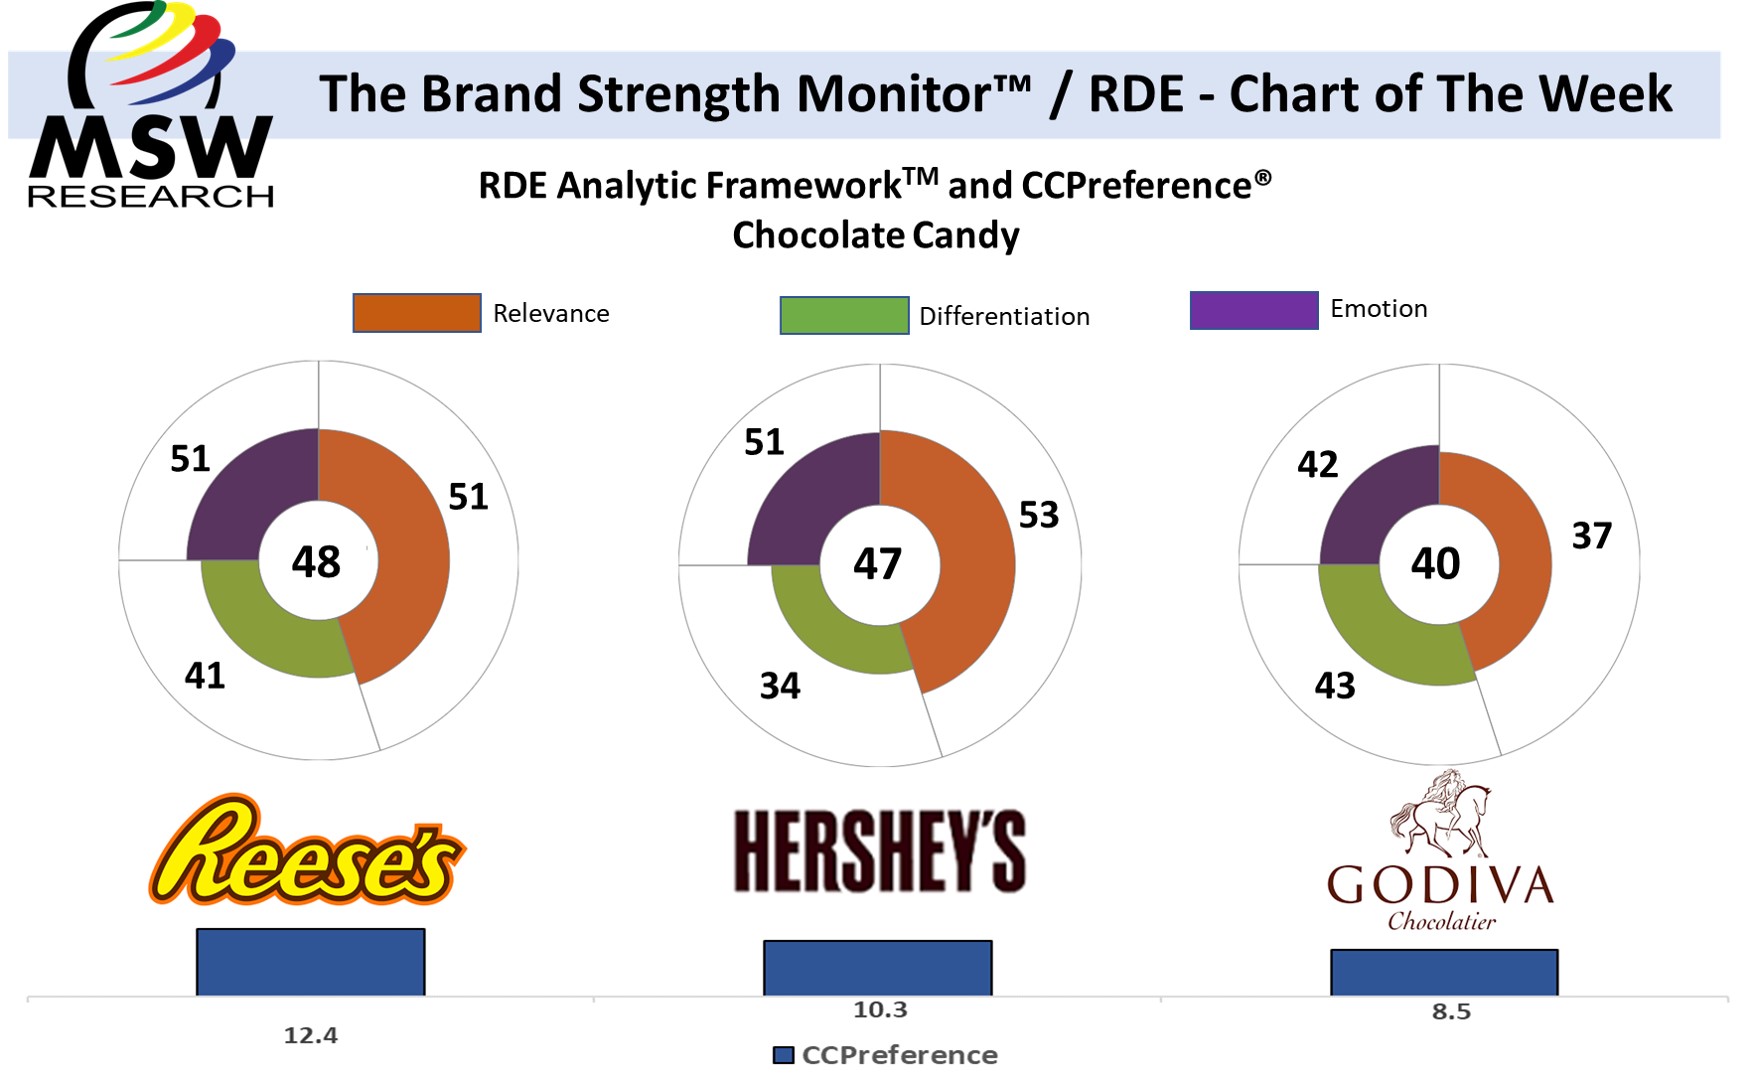
| The Brand Strength Monitor / RDE – Chart of the Week | Chocolate Candy
MSW’s RDE Analytic Framework rests on a study that found that three equity dimensions (Relevance, Differentiation, Emotion) are responsible for driving a significant portion of brand growth. Our ongoing Chart of the Week series is dedicated to sharing RDE results for a variety of categories. If you have questions about your category or want your own…
-
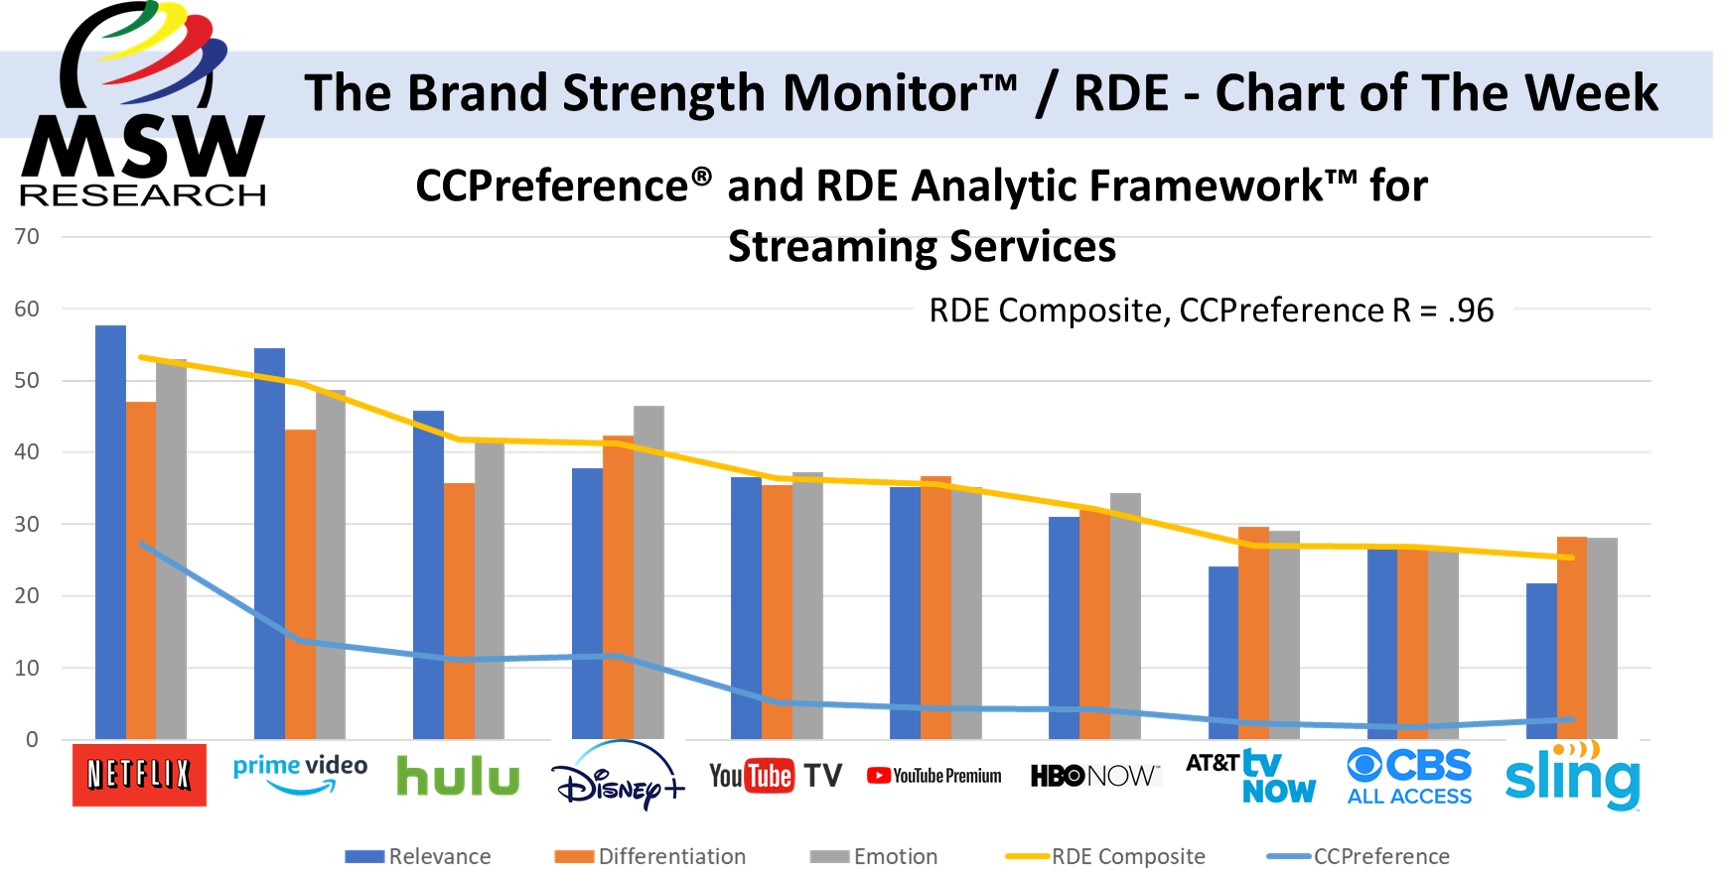
| The Brand Strength Monitor / RDE – Chart of the Week | Streaming Services
MSW’s RDE Analytic Framework rests on a study that found that three equity dimensions (Relevance, Differentiation, Emotion) are responsible for driving a significant portion of brand growth. Our ongoing Chart of the Week series is dedicated to sharing RDE results for a variety of categories. If you have questions about your category or want your own…
-
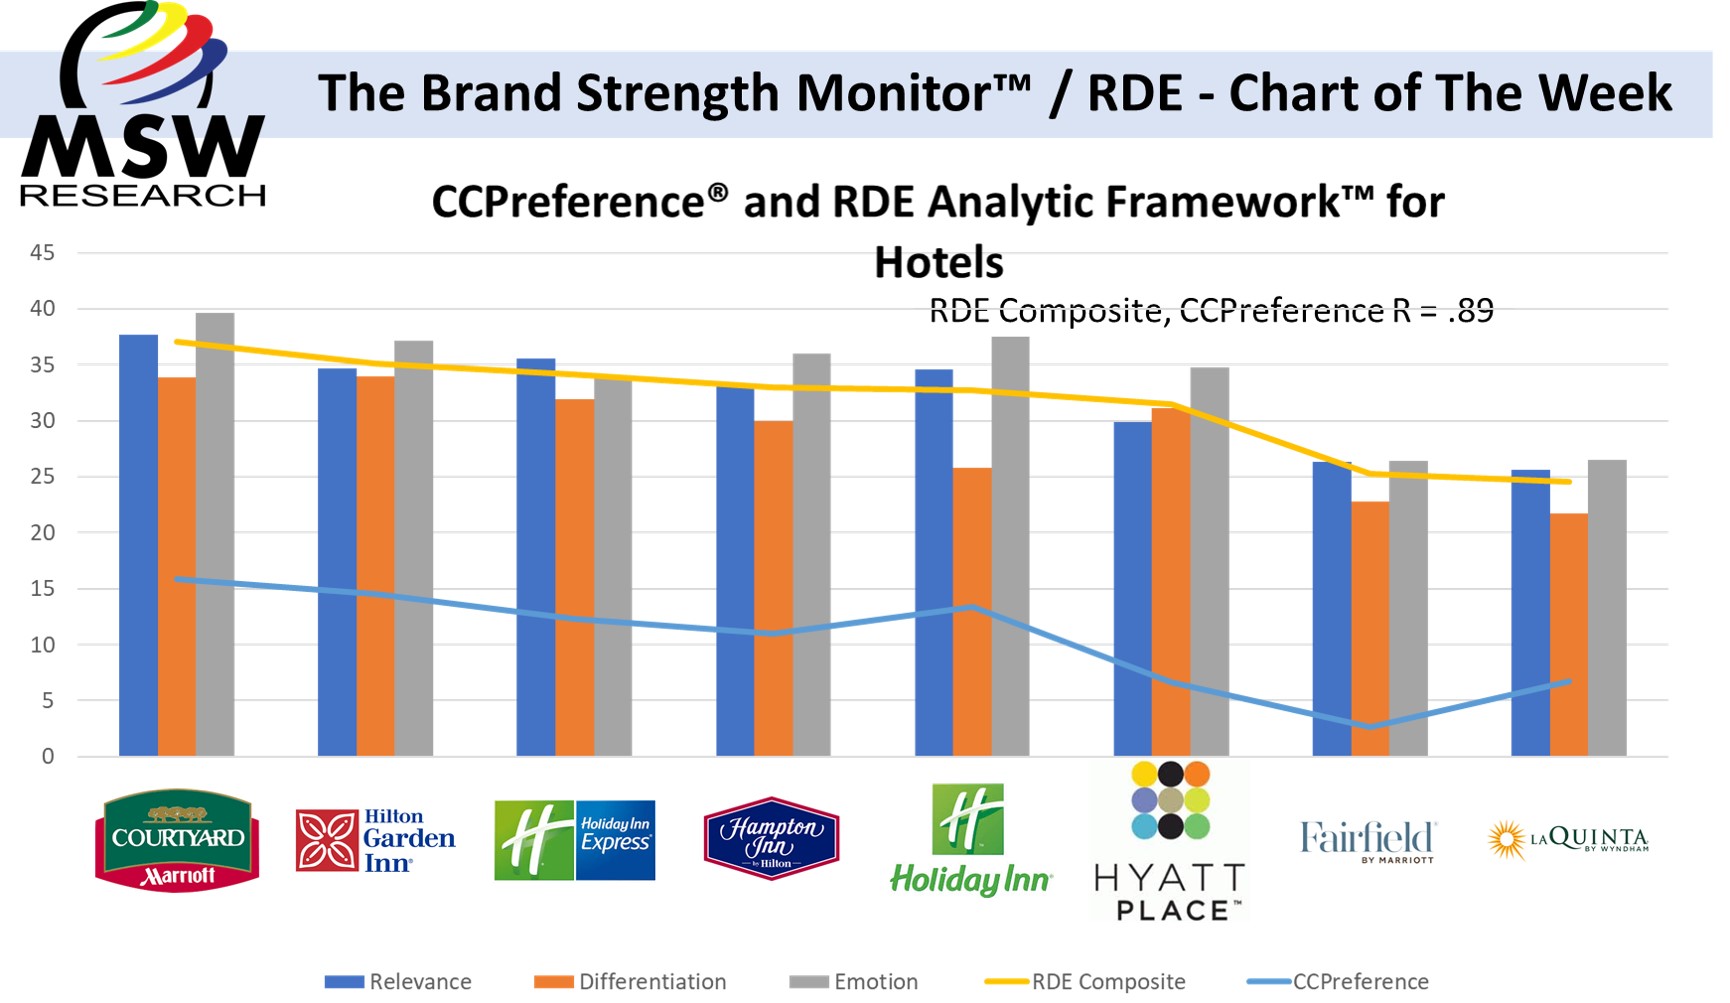
| The Brand Strength Monitor / RDE Chart of the Week | Hotels
MSW’s RDE Analytic Framework rests on a study that found that three equity dimensions (Relevance, Differentiation, Emotion) are responsible for driving a significant portion of brand growth. Our ongoing Chart of the Week series is dedicated to sharing RDE results for a variety of categories. If you have questions about your category or want…
-
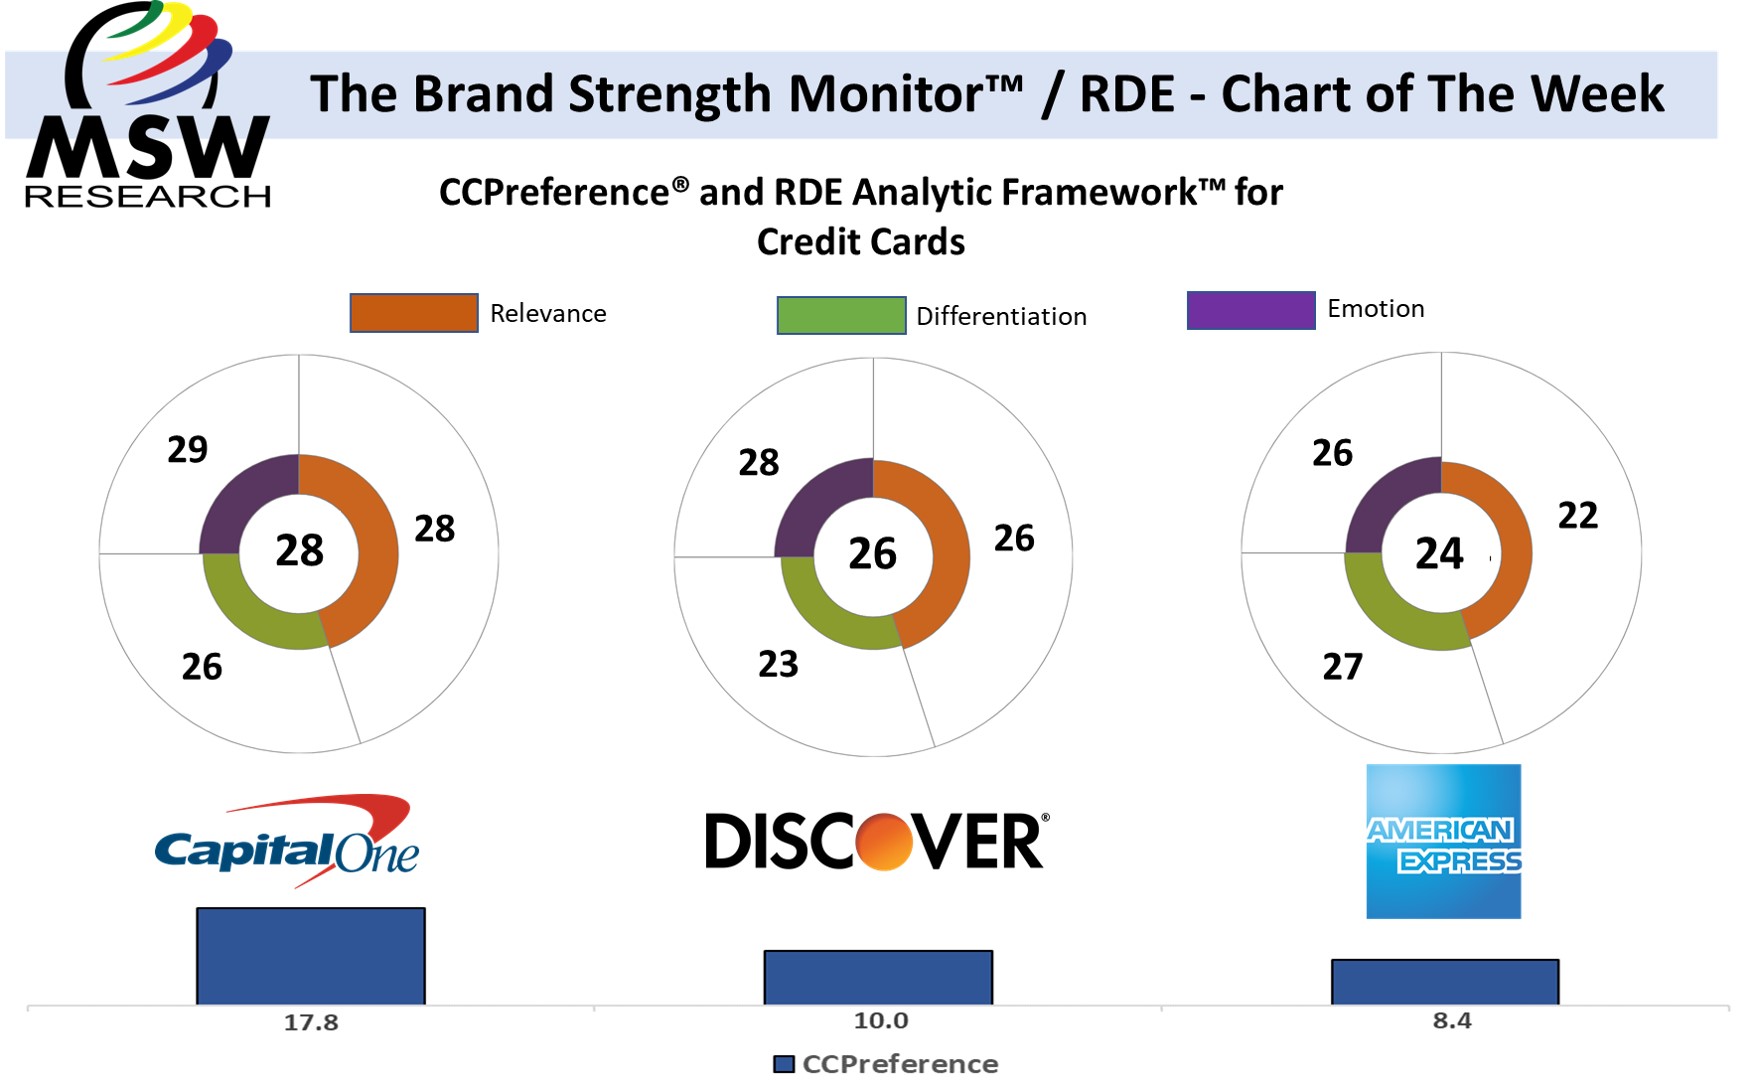
| The Brand Strength Monitor / RDE – Chart of the Week | Credit Cards
MSW’s RDE Analytic Framework rests on a study that found that three equity dimensions (Relevance, Differentiation, Emotion) are responsible for driving a significant portion of brand growth. Our ongoing Chart of the Week series is dedicated to sharing RDE results for a variety of categories. If you have questions about your category or want your own…
-
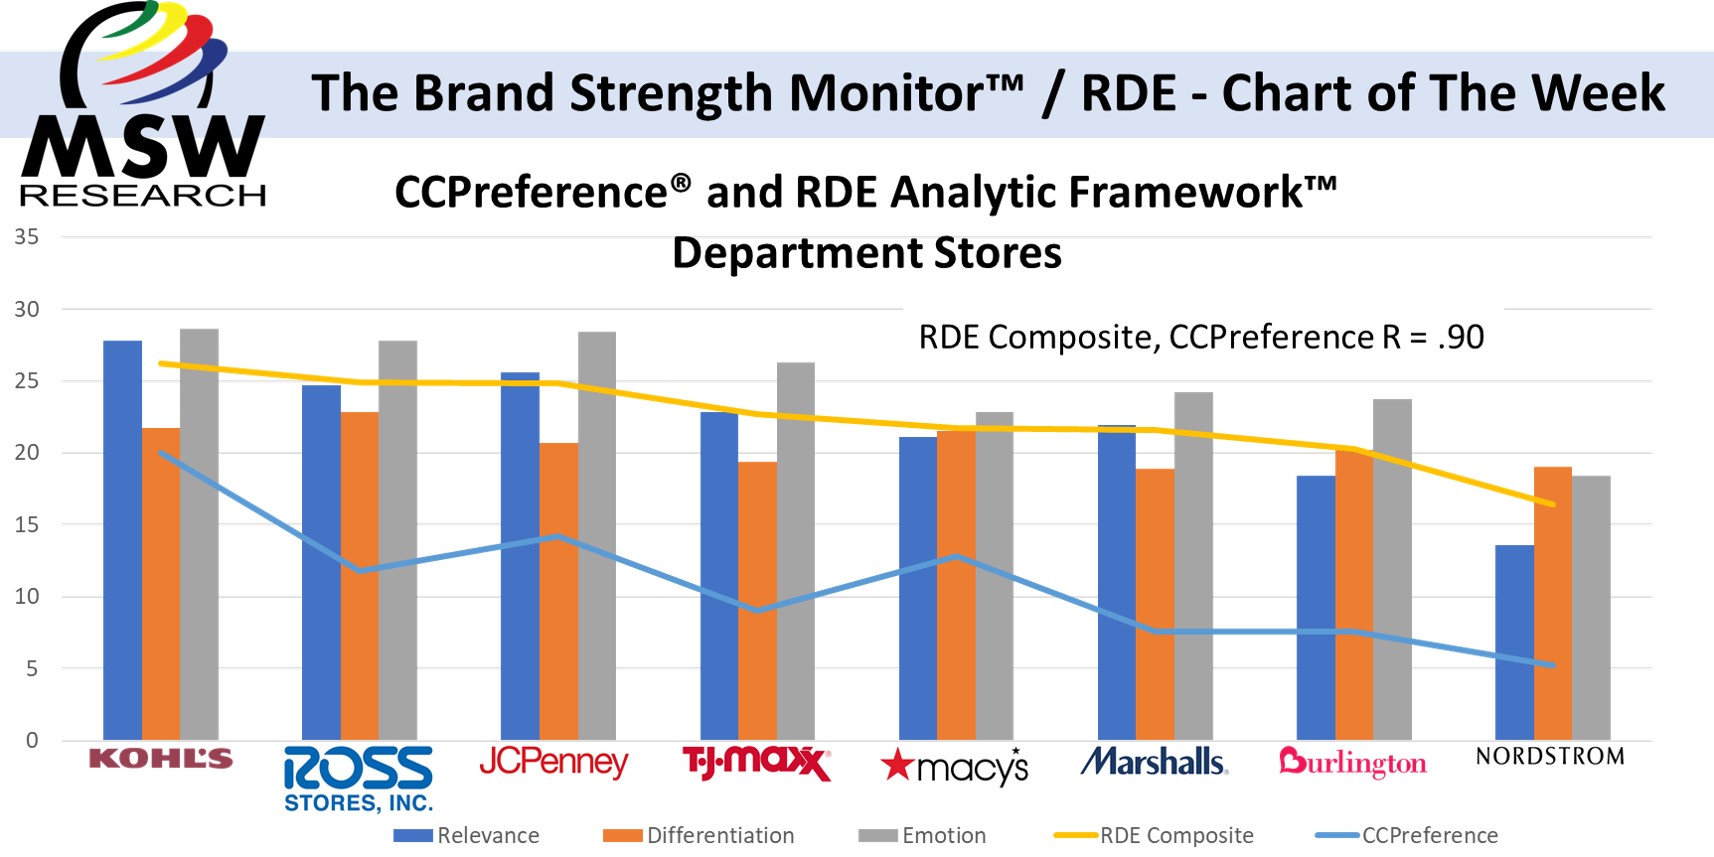
| The Brand Strength Monitor / RDE Chart of the Week | Department Stores
MSW’s RDE Analytic Framework rests on a study that found that three equity dimensions (Relevance, Differentiation, Emotion) are responsible for driving a significant portion of brand growth and brand strength. Our ongoing Chart of the Week series is dedicated to sharing RDE and CCPreference® Brand Strength results for a variety of categories. If you have…
-
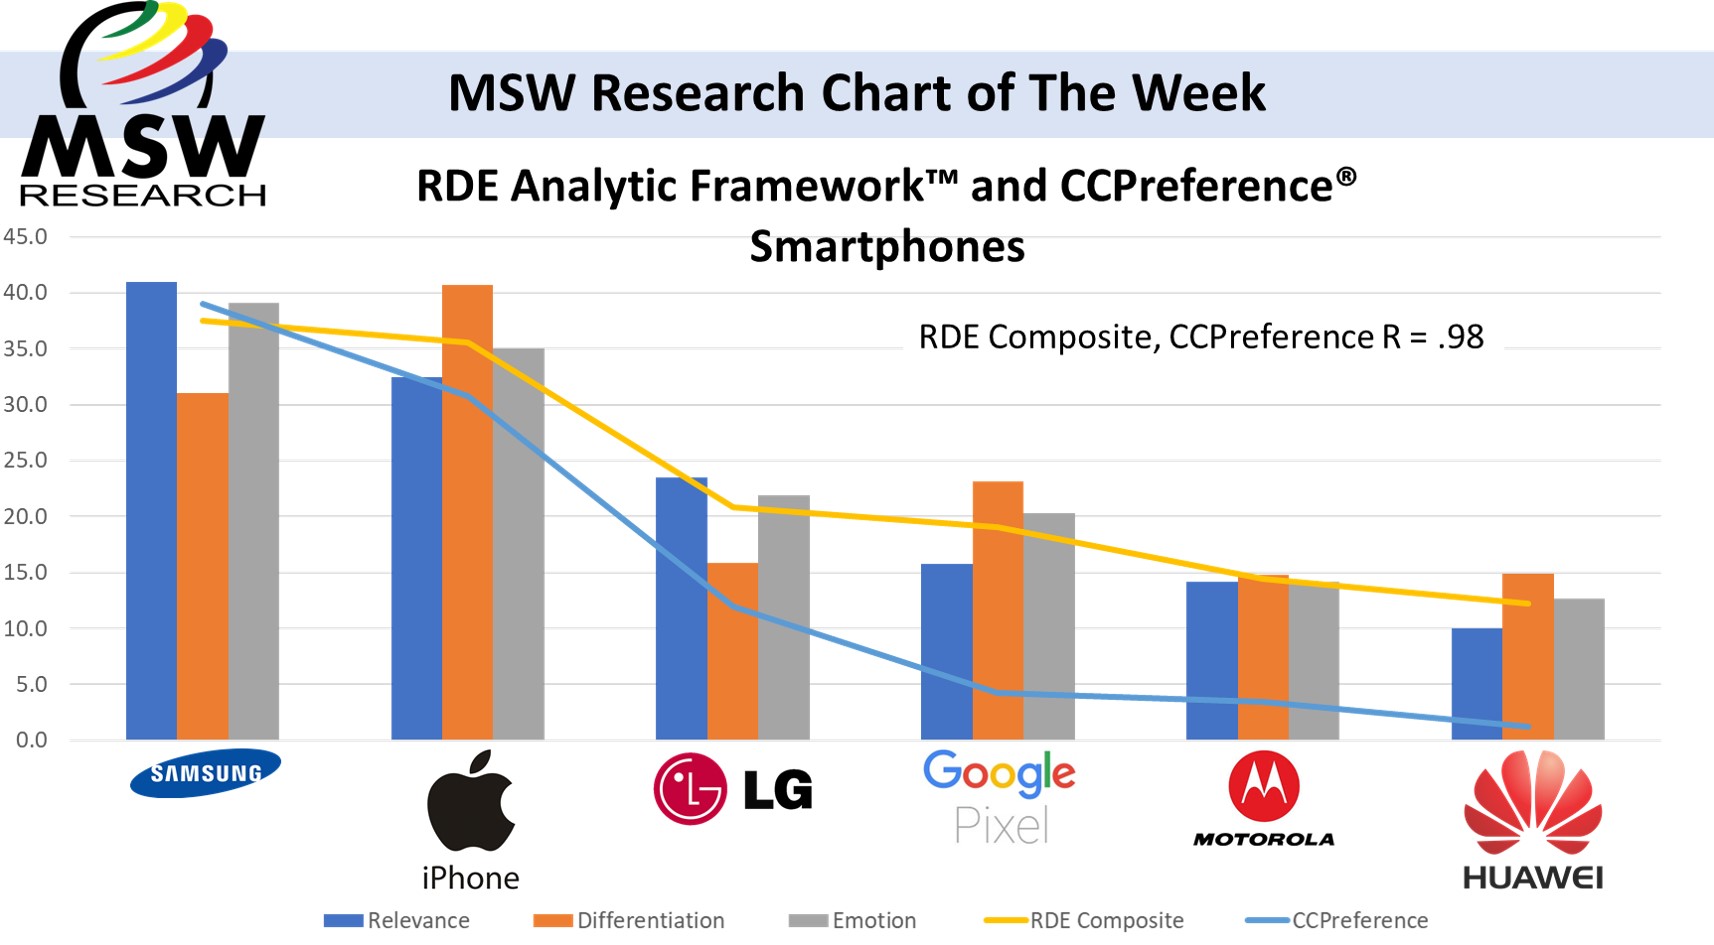
| Chart of the Week | Smartphones
MSW’s RDE Analytic Framework rests on a study that found that three equity dimensions (Relevance, Differentiation, Emotion) are responsible for driving a significant portion of brand growth. Our ongoing Chart of the Week series is dedicated to sharing RDE results for a variety of categories. If you have questions about your category or want your own…