Tag: Brand Preference
-
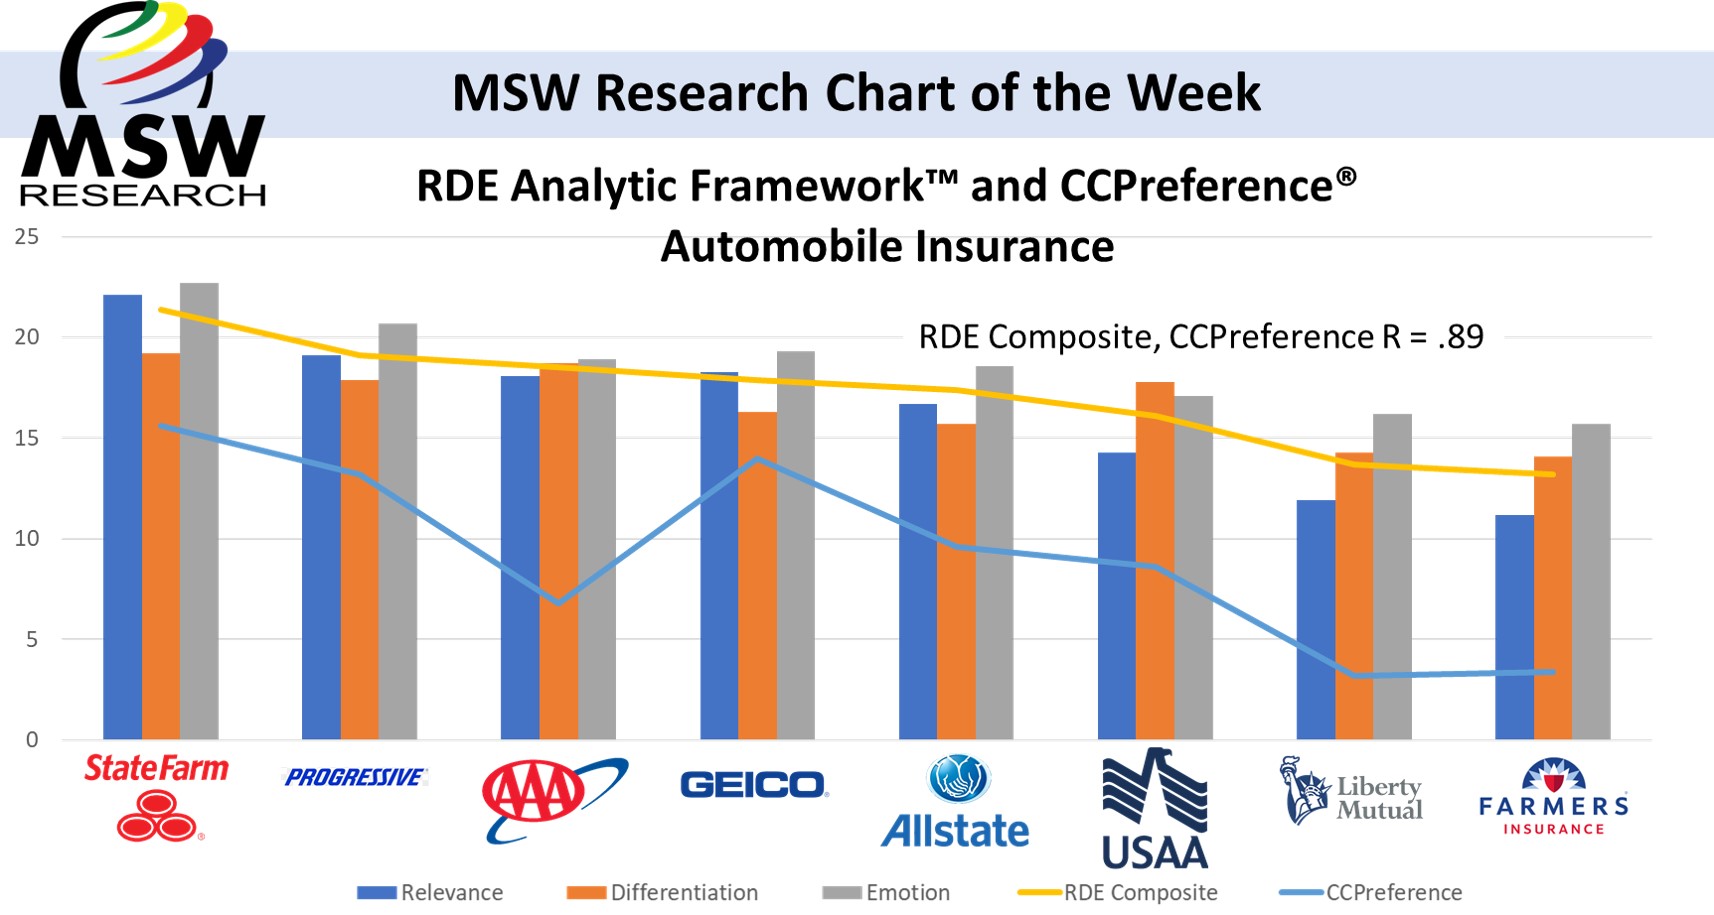
| Chart of The Week | Automobile Insurance: Change in Brand Preference and Share 2021 vs 2023
The MSW TBSM tracking service measures brand preference as one component of the survey. Using TBSM Auto Insurance category data, changes in brand preference results between 2021 and 2023 were computed for individual brands. Our Chart of the Week displays these results for the three top players in the US Auto Insurance market: State Farm,…
-
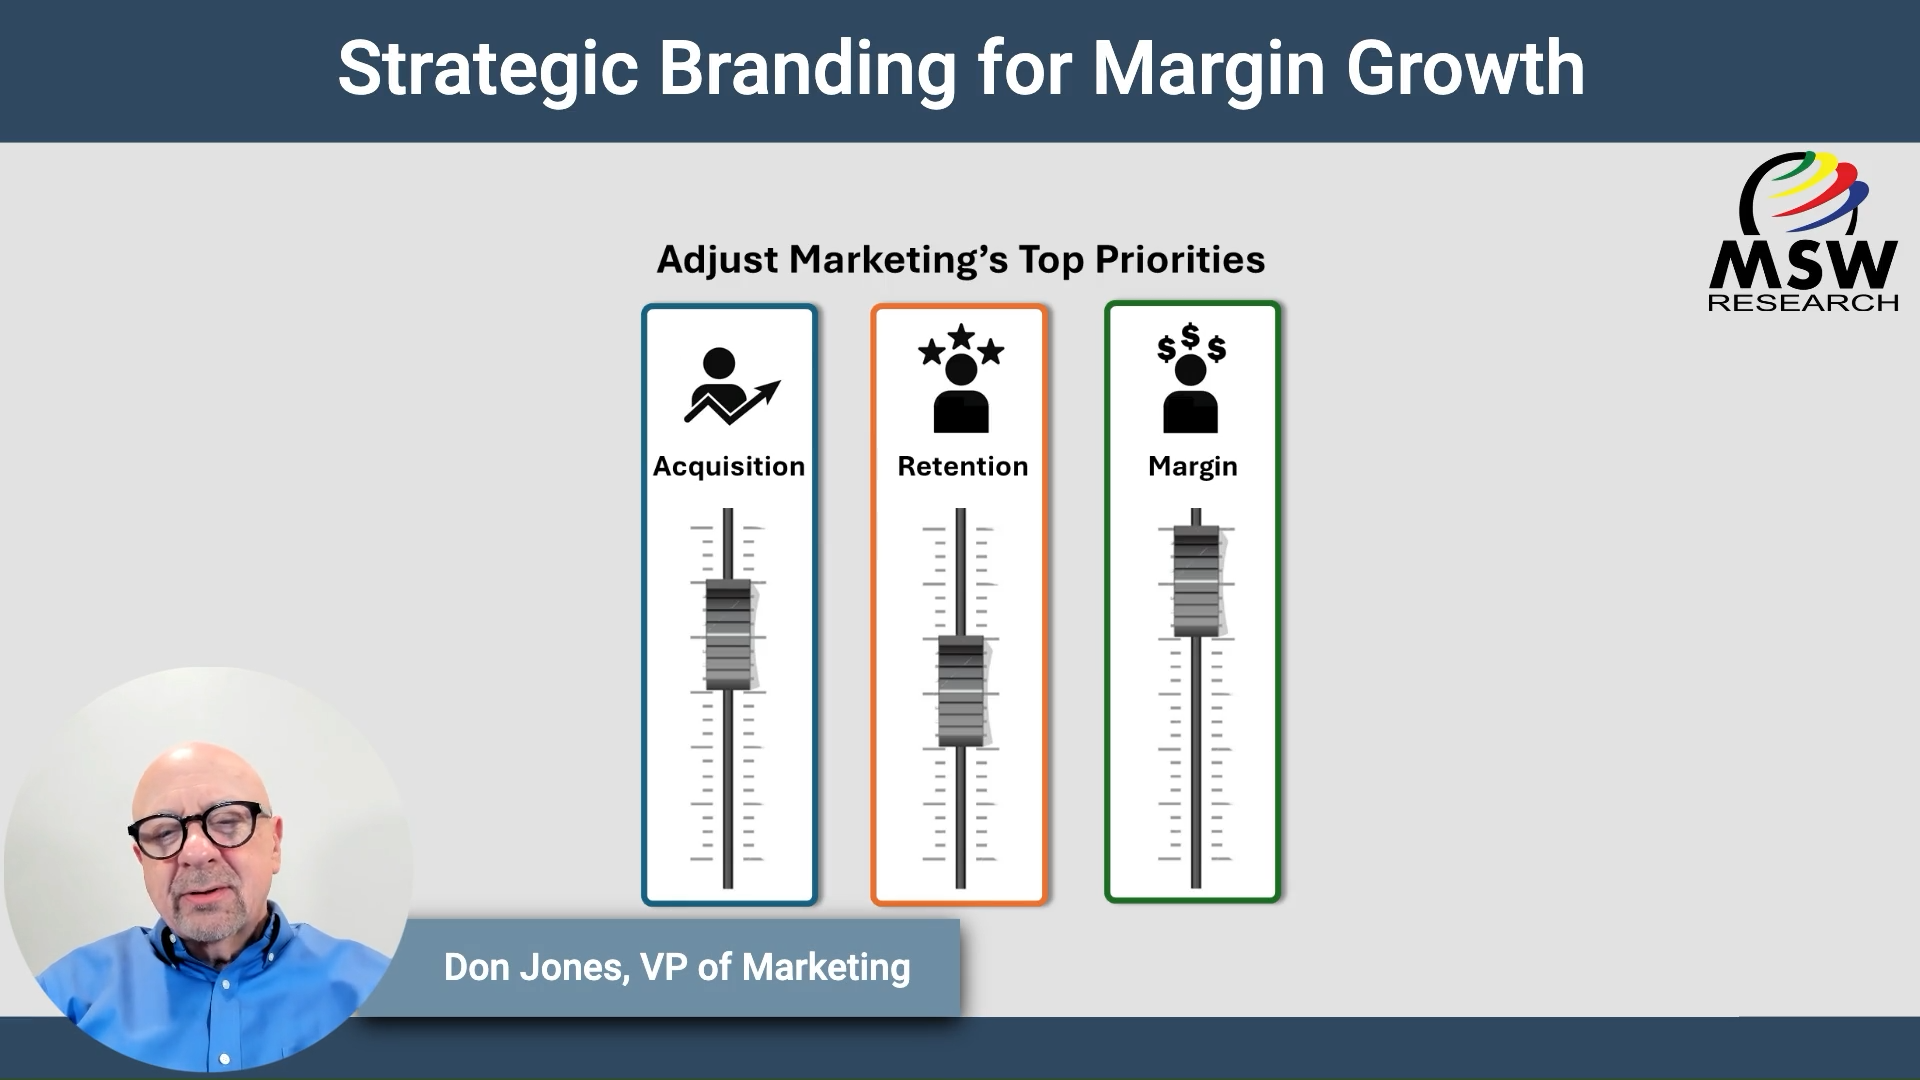
| Video Blog | Strategic Branding for Margin Growth
In the realm of successful brands, one thing stands out: distinctive brand assets. Whether it’s a memorable color, logo, design, or jingle, these cues aid in memory encoding and signal availability. Yet, the true value of these assets lies in the eyes of consumers. They expect a return on their investment in terms of time,…
-
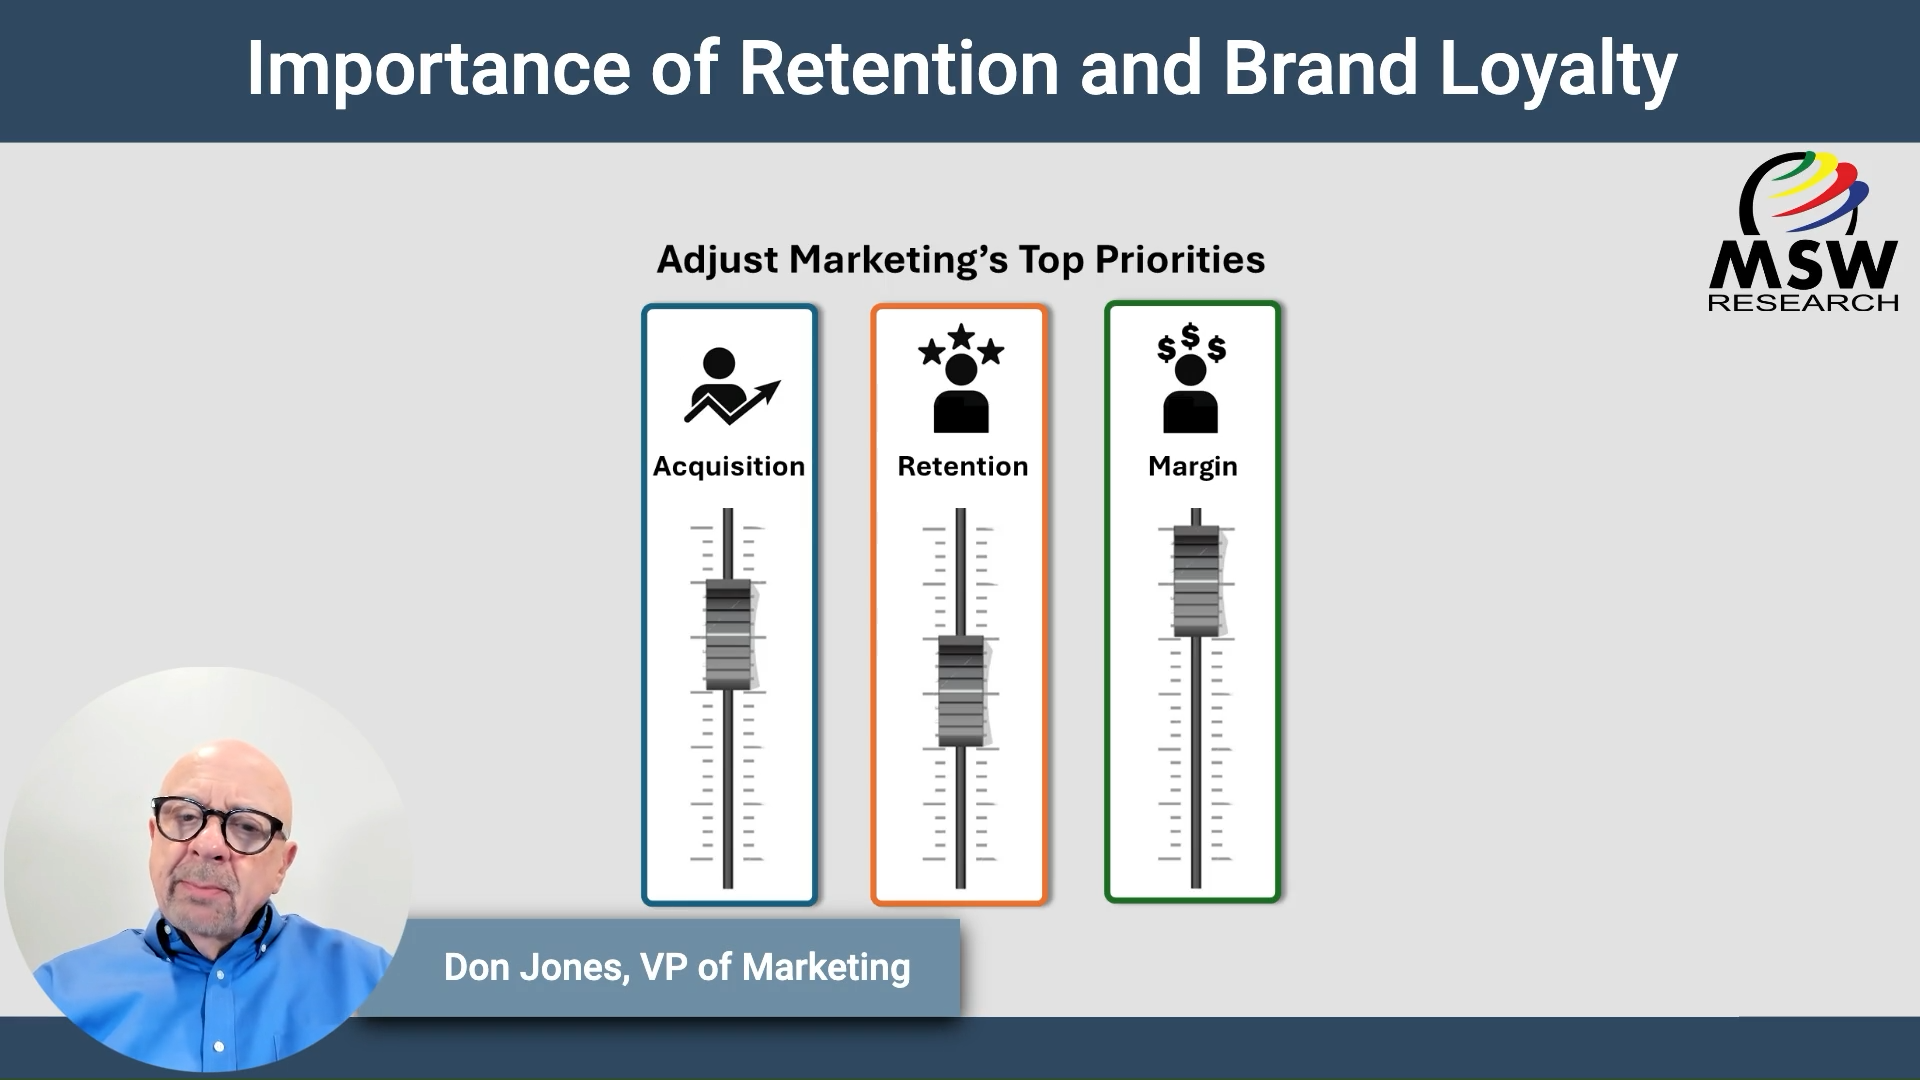
| Video Blog | Importance of Retention and Brand Loyalty
In the world of brands, loyalty reigns supreme. Yet, the truth is, most consumers aren’t loyal to any single brand. At MSW Research, we delve beyond behavioral loyalty, focusing on attitudinal loyalty—the kind that makes a brand their top choice, their go-to. Our research reveals a stark reality: only half of all customers feel loyal…
-

MSW’s AI Creative Effectiveness Score℠ – A NEW AI Tool From MSW
MSW’s Creative Effectiveness Score℠ Harnessing the power of Artificial Intelligence, trained on 50+ years of advertising research, to enable faster, more predictive decision making. With the use of Artificial Intelligence, blended with human insights, the MSW Creative Effectiveness Score is the most predictive AI based creative measurement in the industry. It is faster and predicts…
-
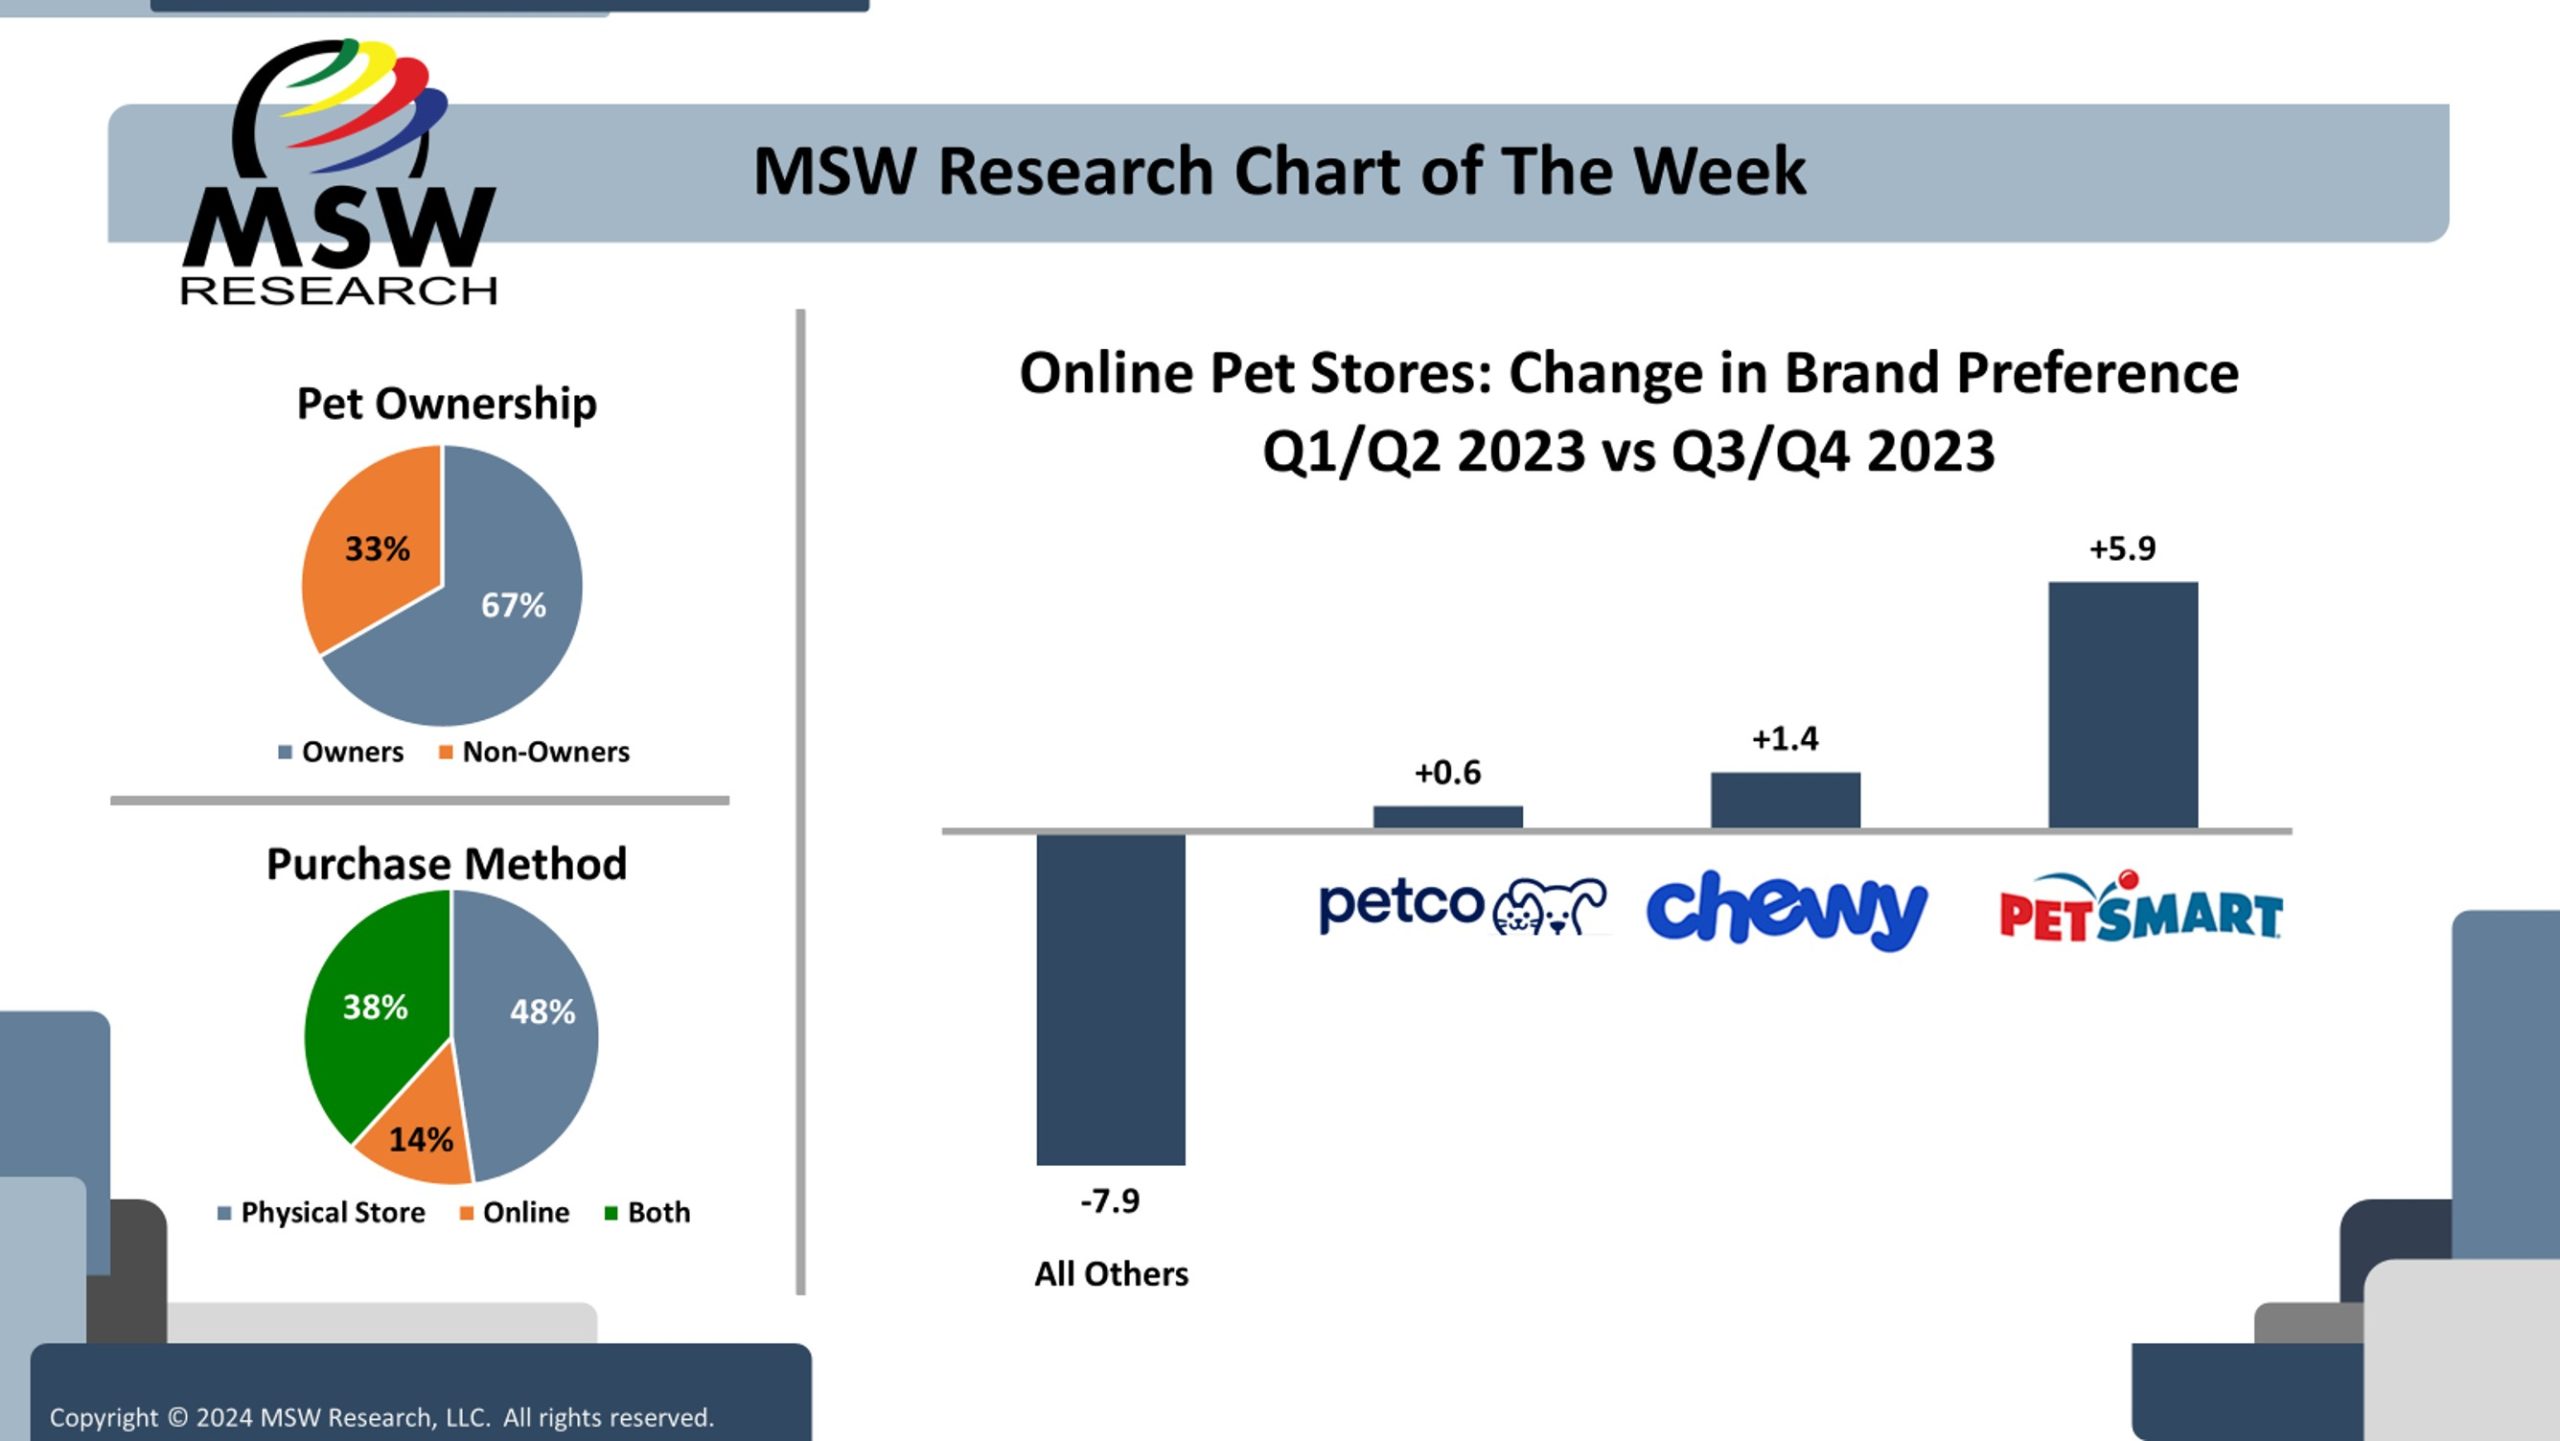
| Chart of The Week | Online Pet Stores
The MSW TBSM tracking service measures brand preference as one component of the survey. Brand preference was collected quarterly for eleven major Online Pet Store brands during 2023 (among 500 respondents each quarter). This week’s chart examines the changes in brand preference from the first half to the second half of 2023 for the three…
-
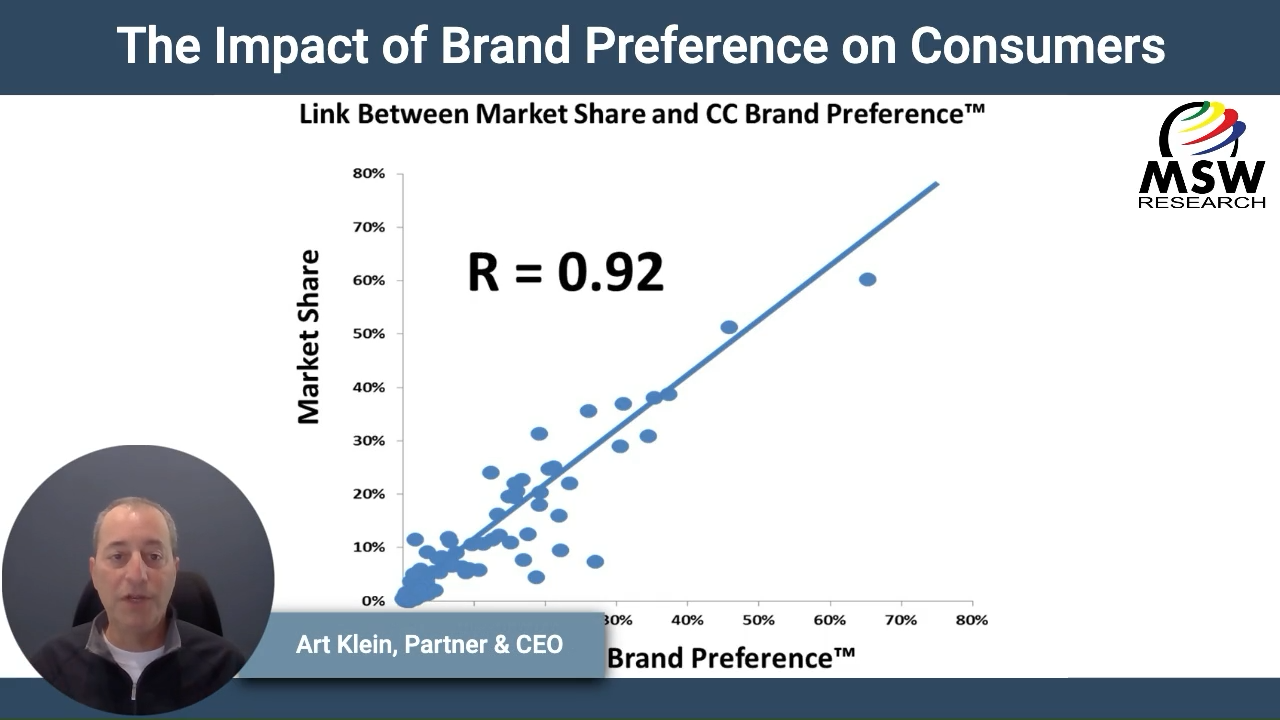
| Video Blog | The Impact of Brand Preference on Consumers
Brand Preference has a significant influence over consumer behavior. Understanding consumer behavior is key to unlocking brand success. At the heart of this understanding lies Brand Preference—a powerful force that shapes consumer decisions and drives brand growth. Here’s why Brand Preference stands out as a leading metric in brand marketing: 1️⃣ Brand Preference leads to…
-
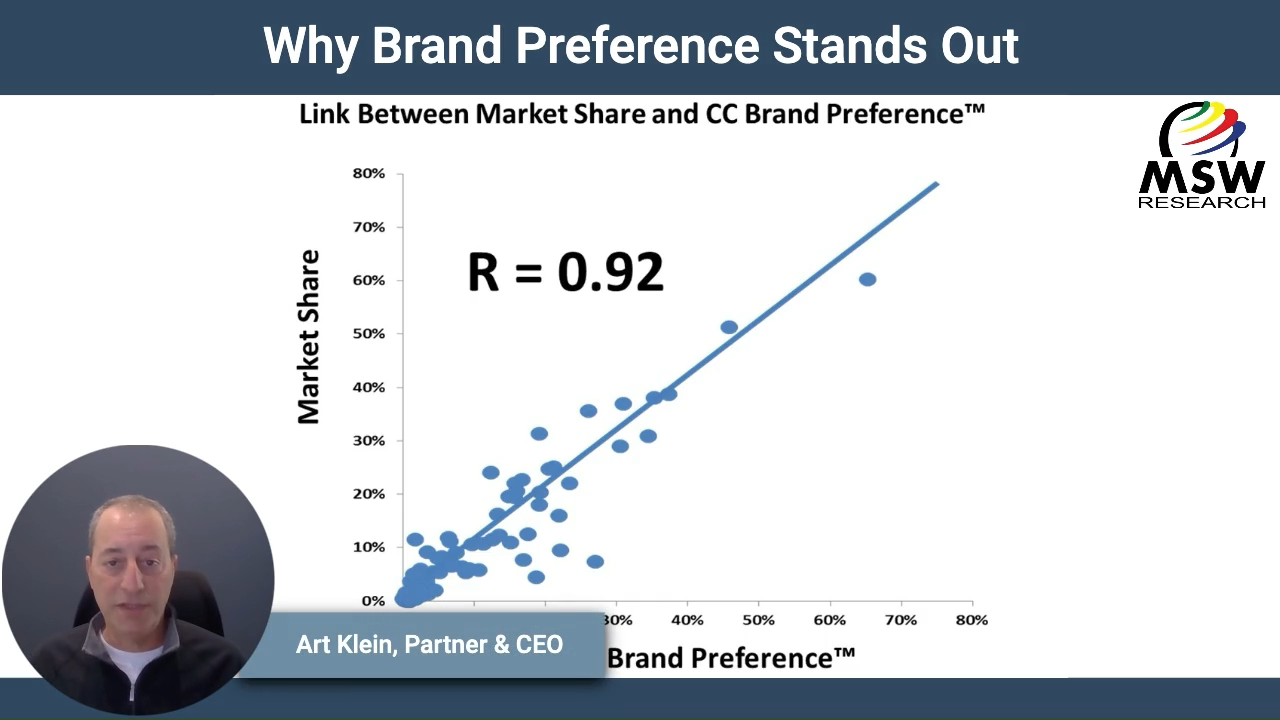
| Video Blog | Why Brand Preference Stands Out
There’s no denying it—Brand Preference stands tall among the metrics in brand marketing. But what sets it apart? Quirk’s Media, a leading publication in market research, has underscored MSW’s validation to real business results, a testament to our commitment to precision in advertising measurement. Marketing-Accountability-Standards-Board praises Touchpoint, our copy-testing system, for its unmatched ability to predict…
-
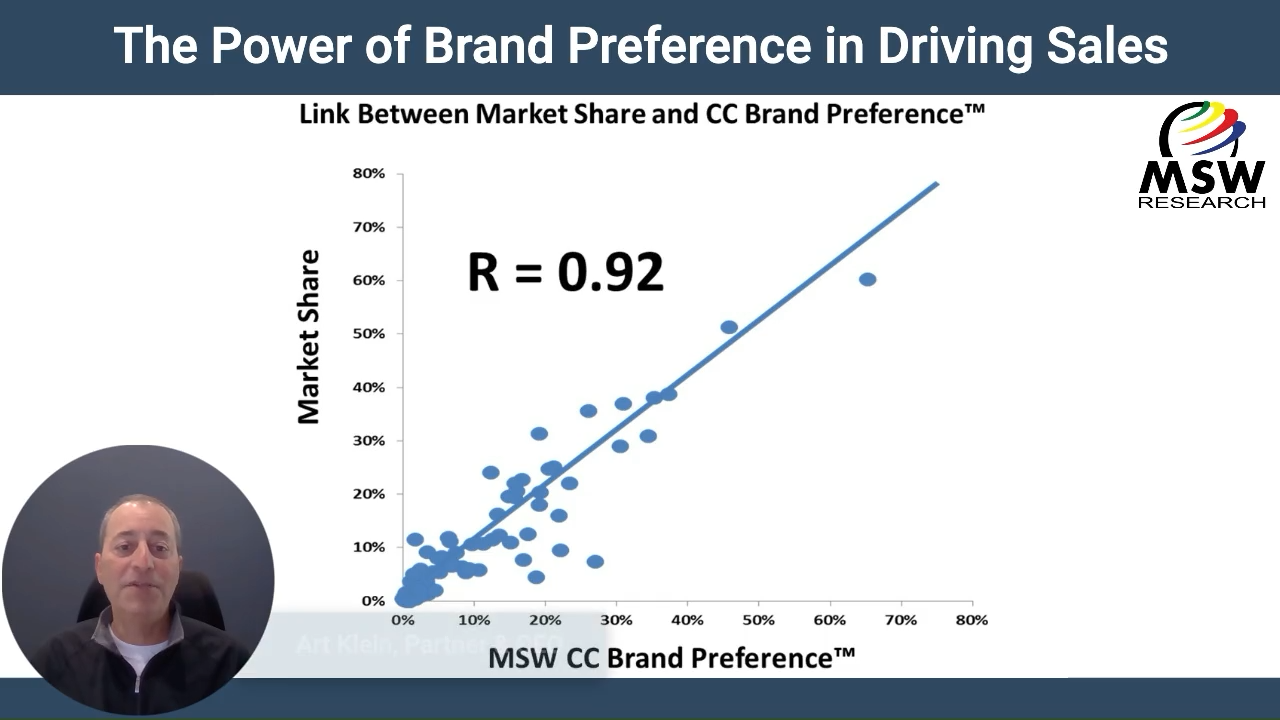
| Video Blog | The Power of Brand Preference in Driving Sales
MSW Research‘s Predictive Brand Framework integrates proven metrics and diagnostic measures, guiding brands across the development cycle – from inception to tracking feedback. Brand Preference, a consistent measure throughout, boasts a remarkable correlation to sales and market share. This correlation fuels accurate forecasts, like our customer acquisition predictions, painting a precise picture of market movement.…
-
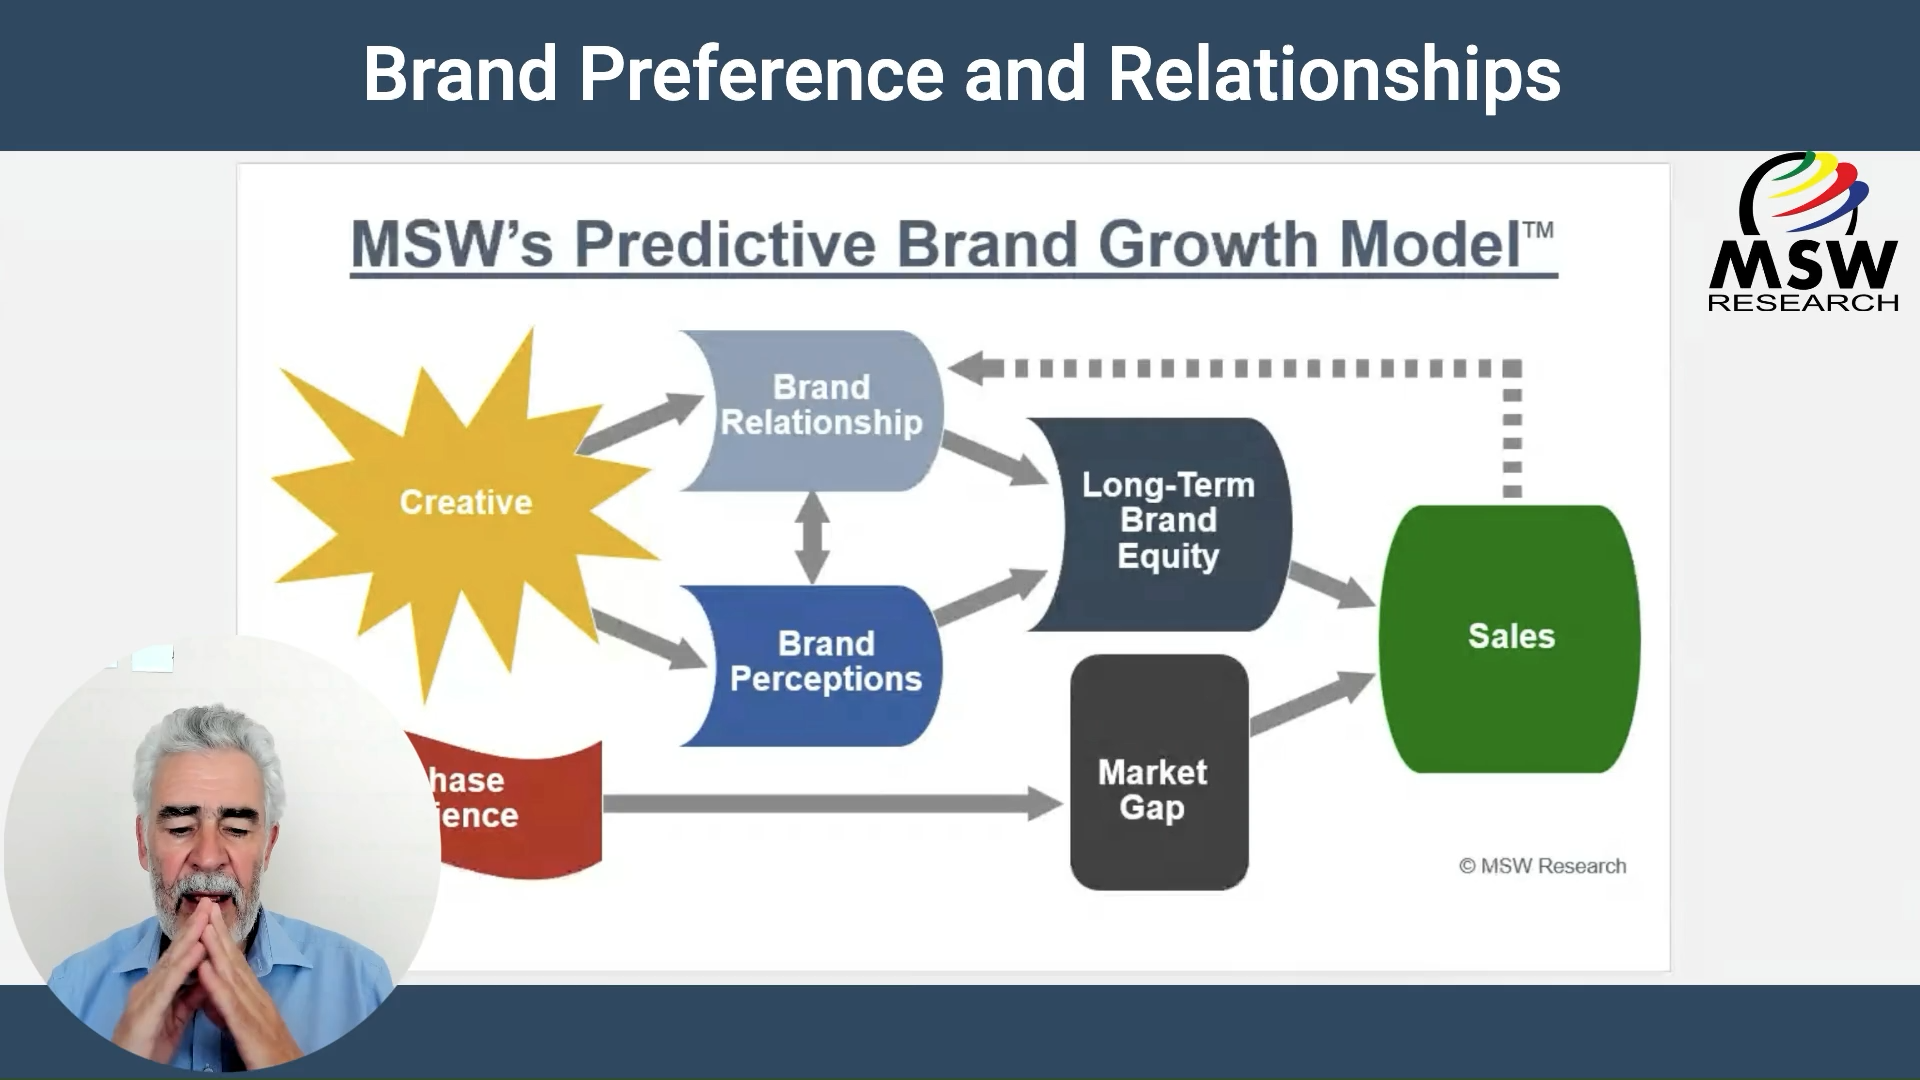
| Video Blog | Brand Perceptions and Relationships
Every brand interaction shapes a relationship. Whether it’s brand loyalty, indifference, or discovery, each encounter influences the narrative in consumers’ minds. At MSW Research, we understand that brands exist within the intricate web of perceptions and relationships. But what drives these relationships? Brands reside in the psyche, a culmination of associations, emotions, and experiences. Perceptions,…
-
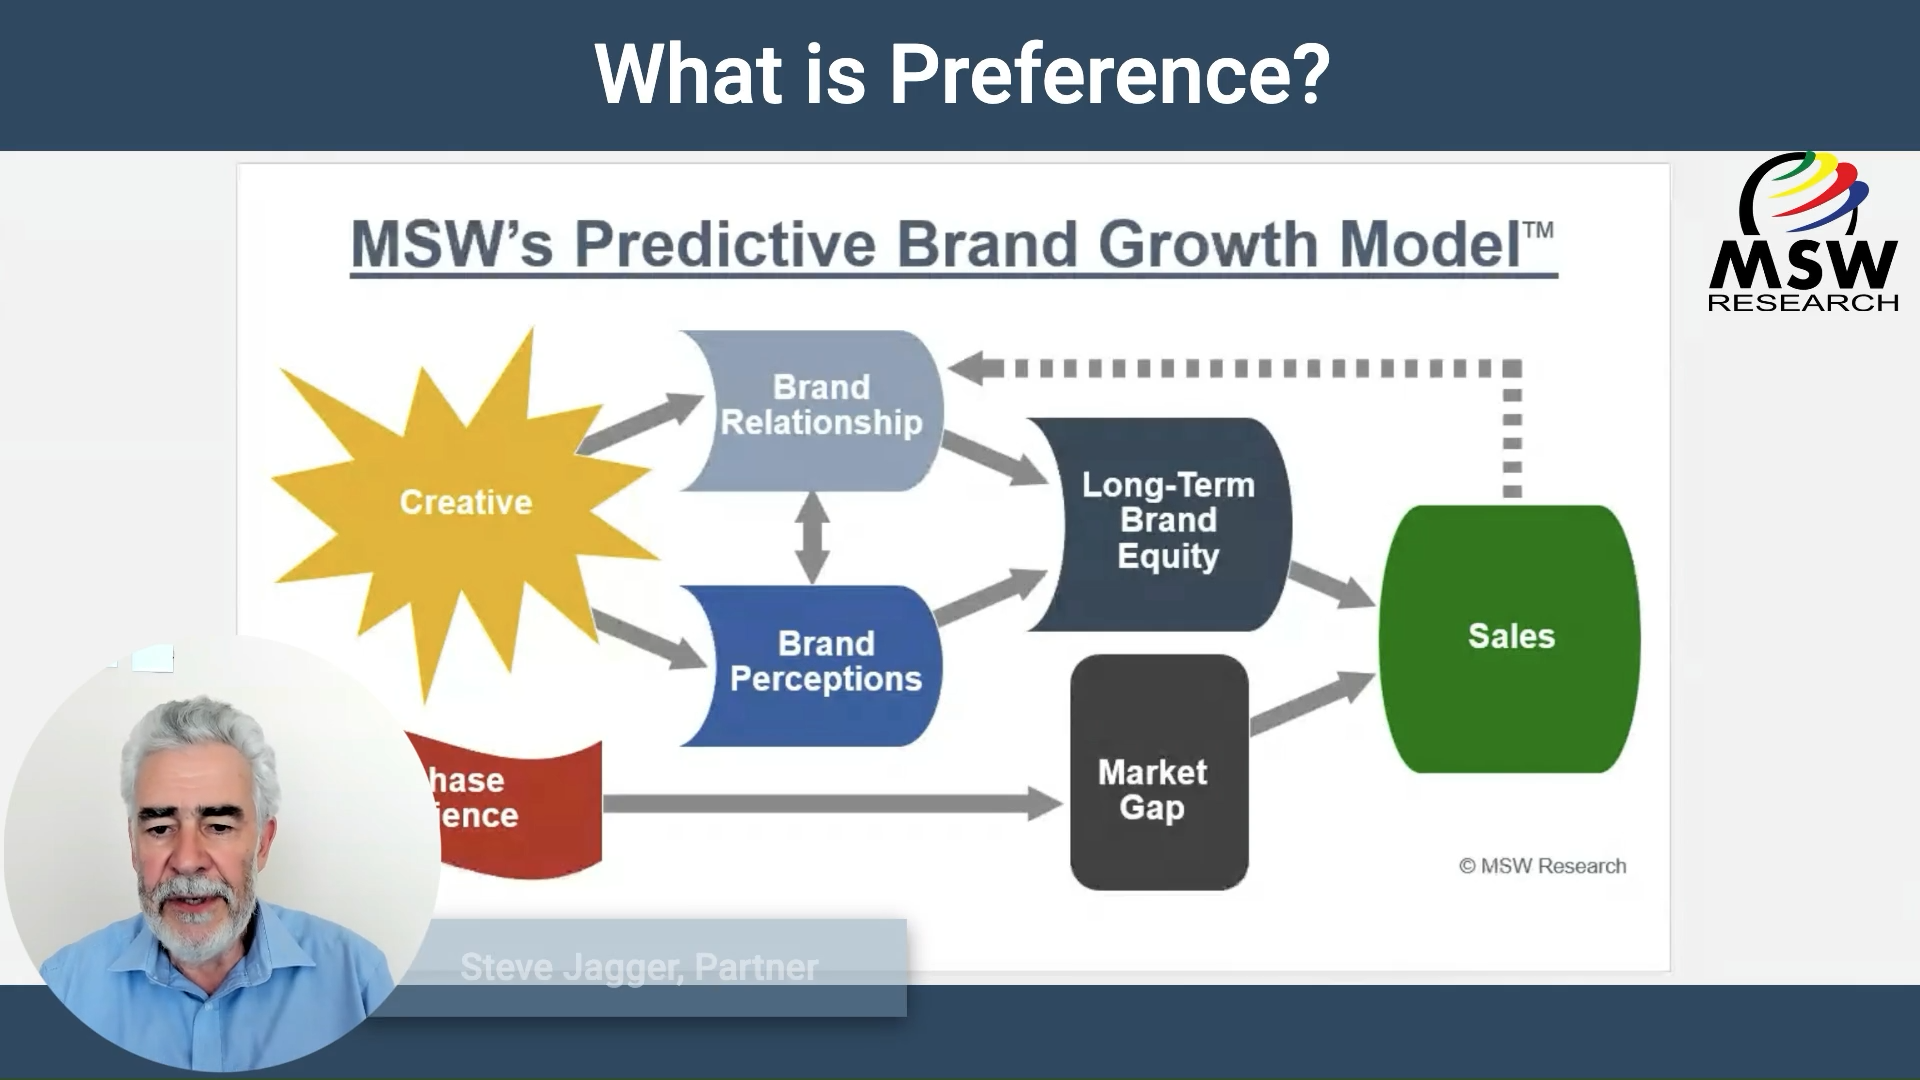
| Video Blog | What is Brand Preference?
Preference is the bedrock of our operations at MSW Research. It’s not just a concept, it’s the compass guiding our every move. Backed by independent validation, Preference stands as the gold standard, revealing the nuances that distinguish brands across borders and through time. But what exactly is Preference? It’s more than a measure; it’s a…