Tag: TBSM
-
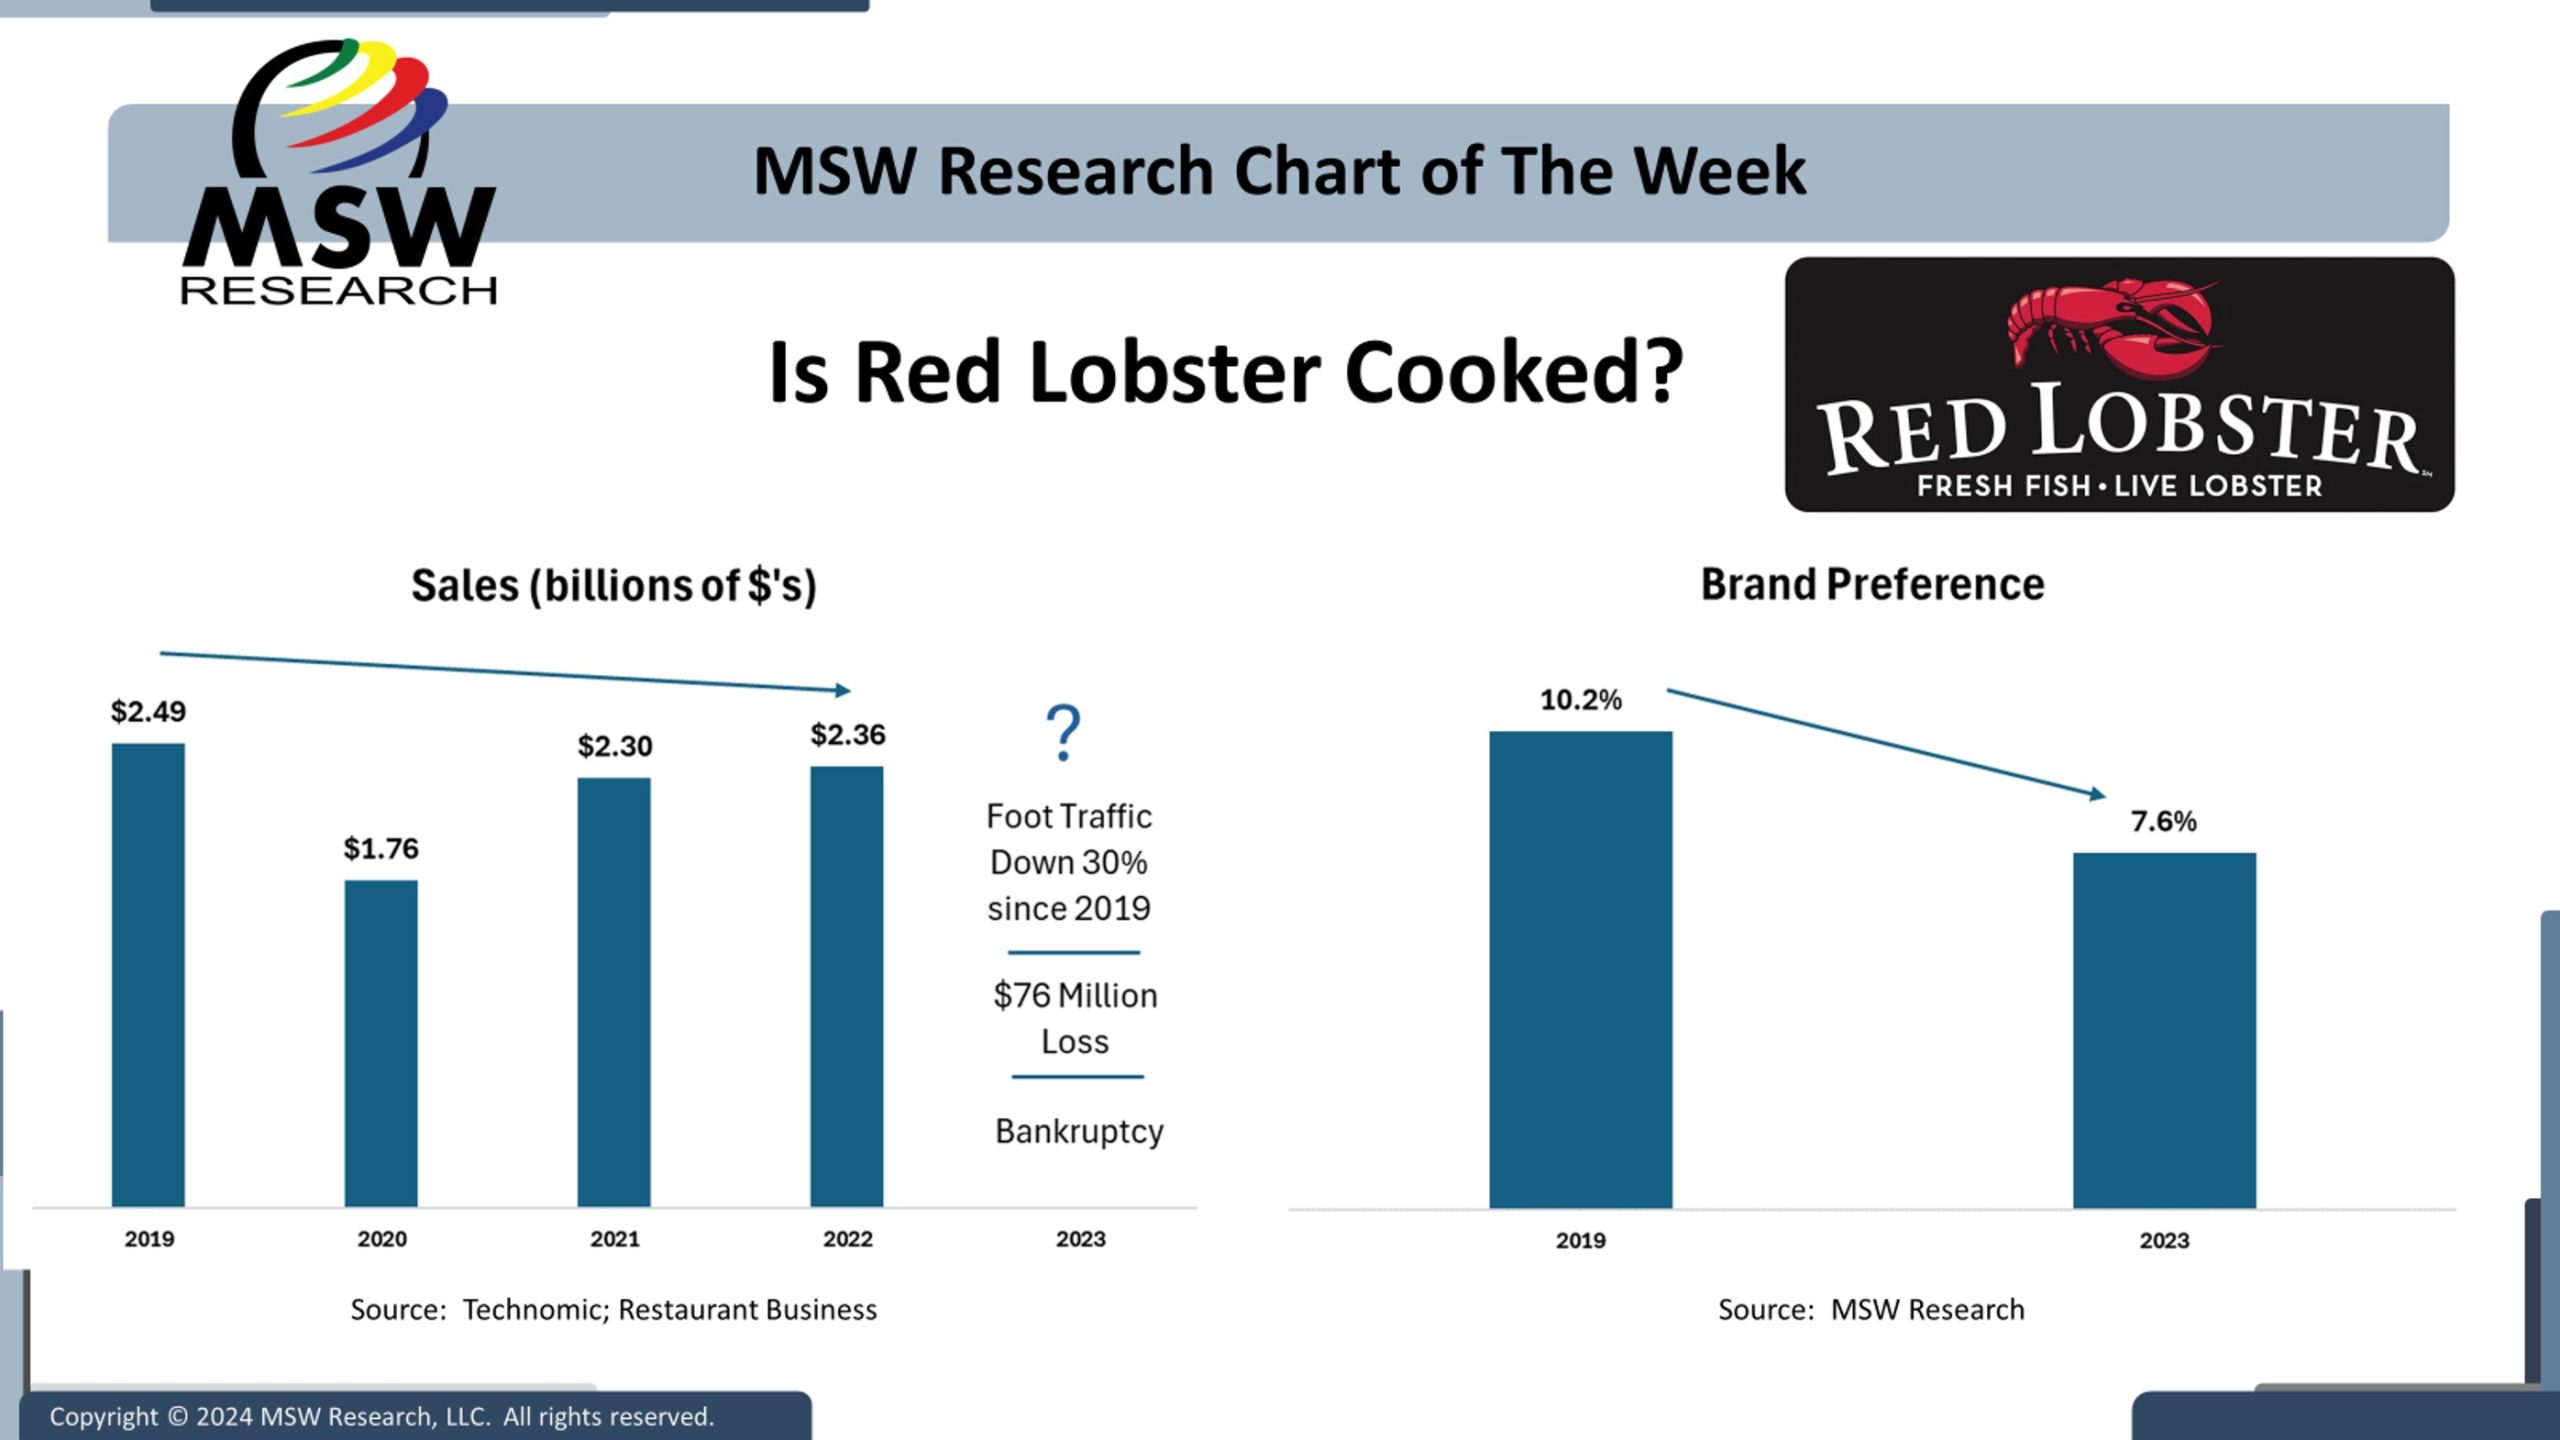
| Chart of The Week | Is Red Lobster Cooked? Yes, but there’s more to the story.
The MSW TBSM tracking service measures brand preference as one component of the survey. We collected Brand Preference data for the Casual Dining Restaurant category in both 2019 and 2023. Included in this competitive set is Red Lobster, which recently declared bankruptcy. This week’s MSW Research Chart of the Week looks at both Brand Preference…
-
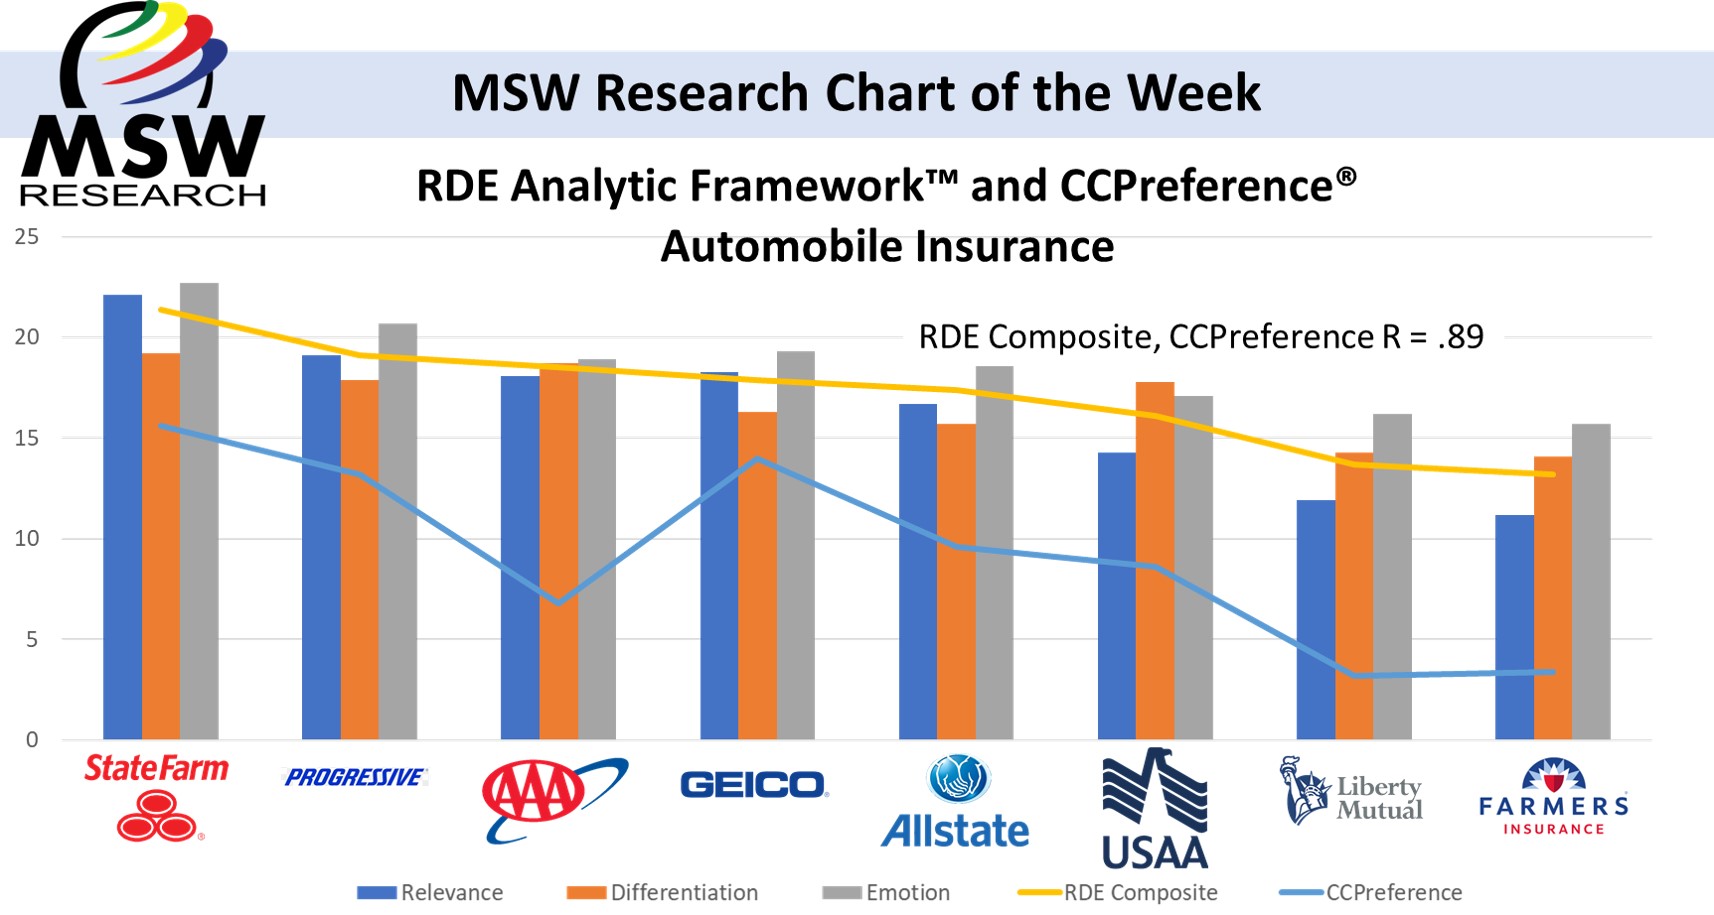
| Chart of The Week | Automobile Insurance: Change in Brand Preference and Share 2021 vs 2023
The MSW TBSM tracking service measures brand preference as one component of the survey. Using TBSM Auto Insurance category data, changes in brand preference results between 2021 and 2023 were computed for individual brands. Our Chart of the Week displays these results for the three top players in the US Auto Insurance market: State Farm,…
-
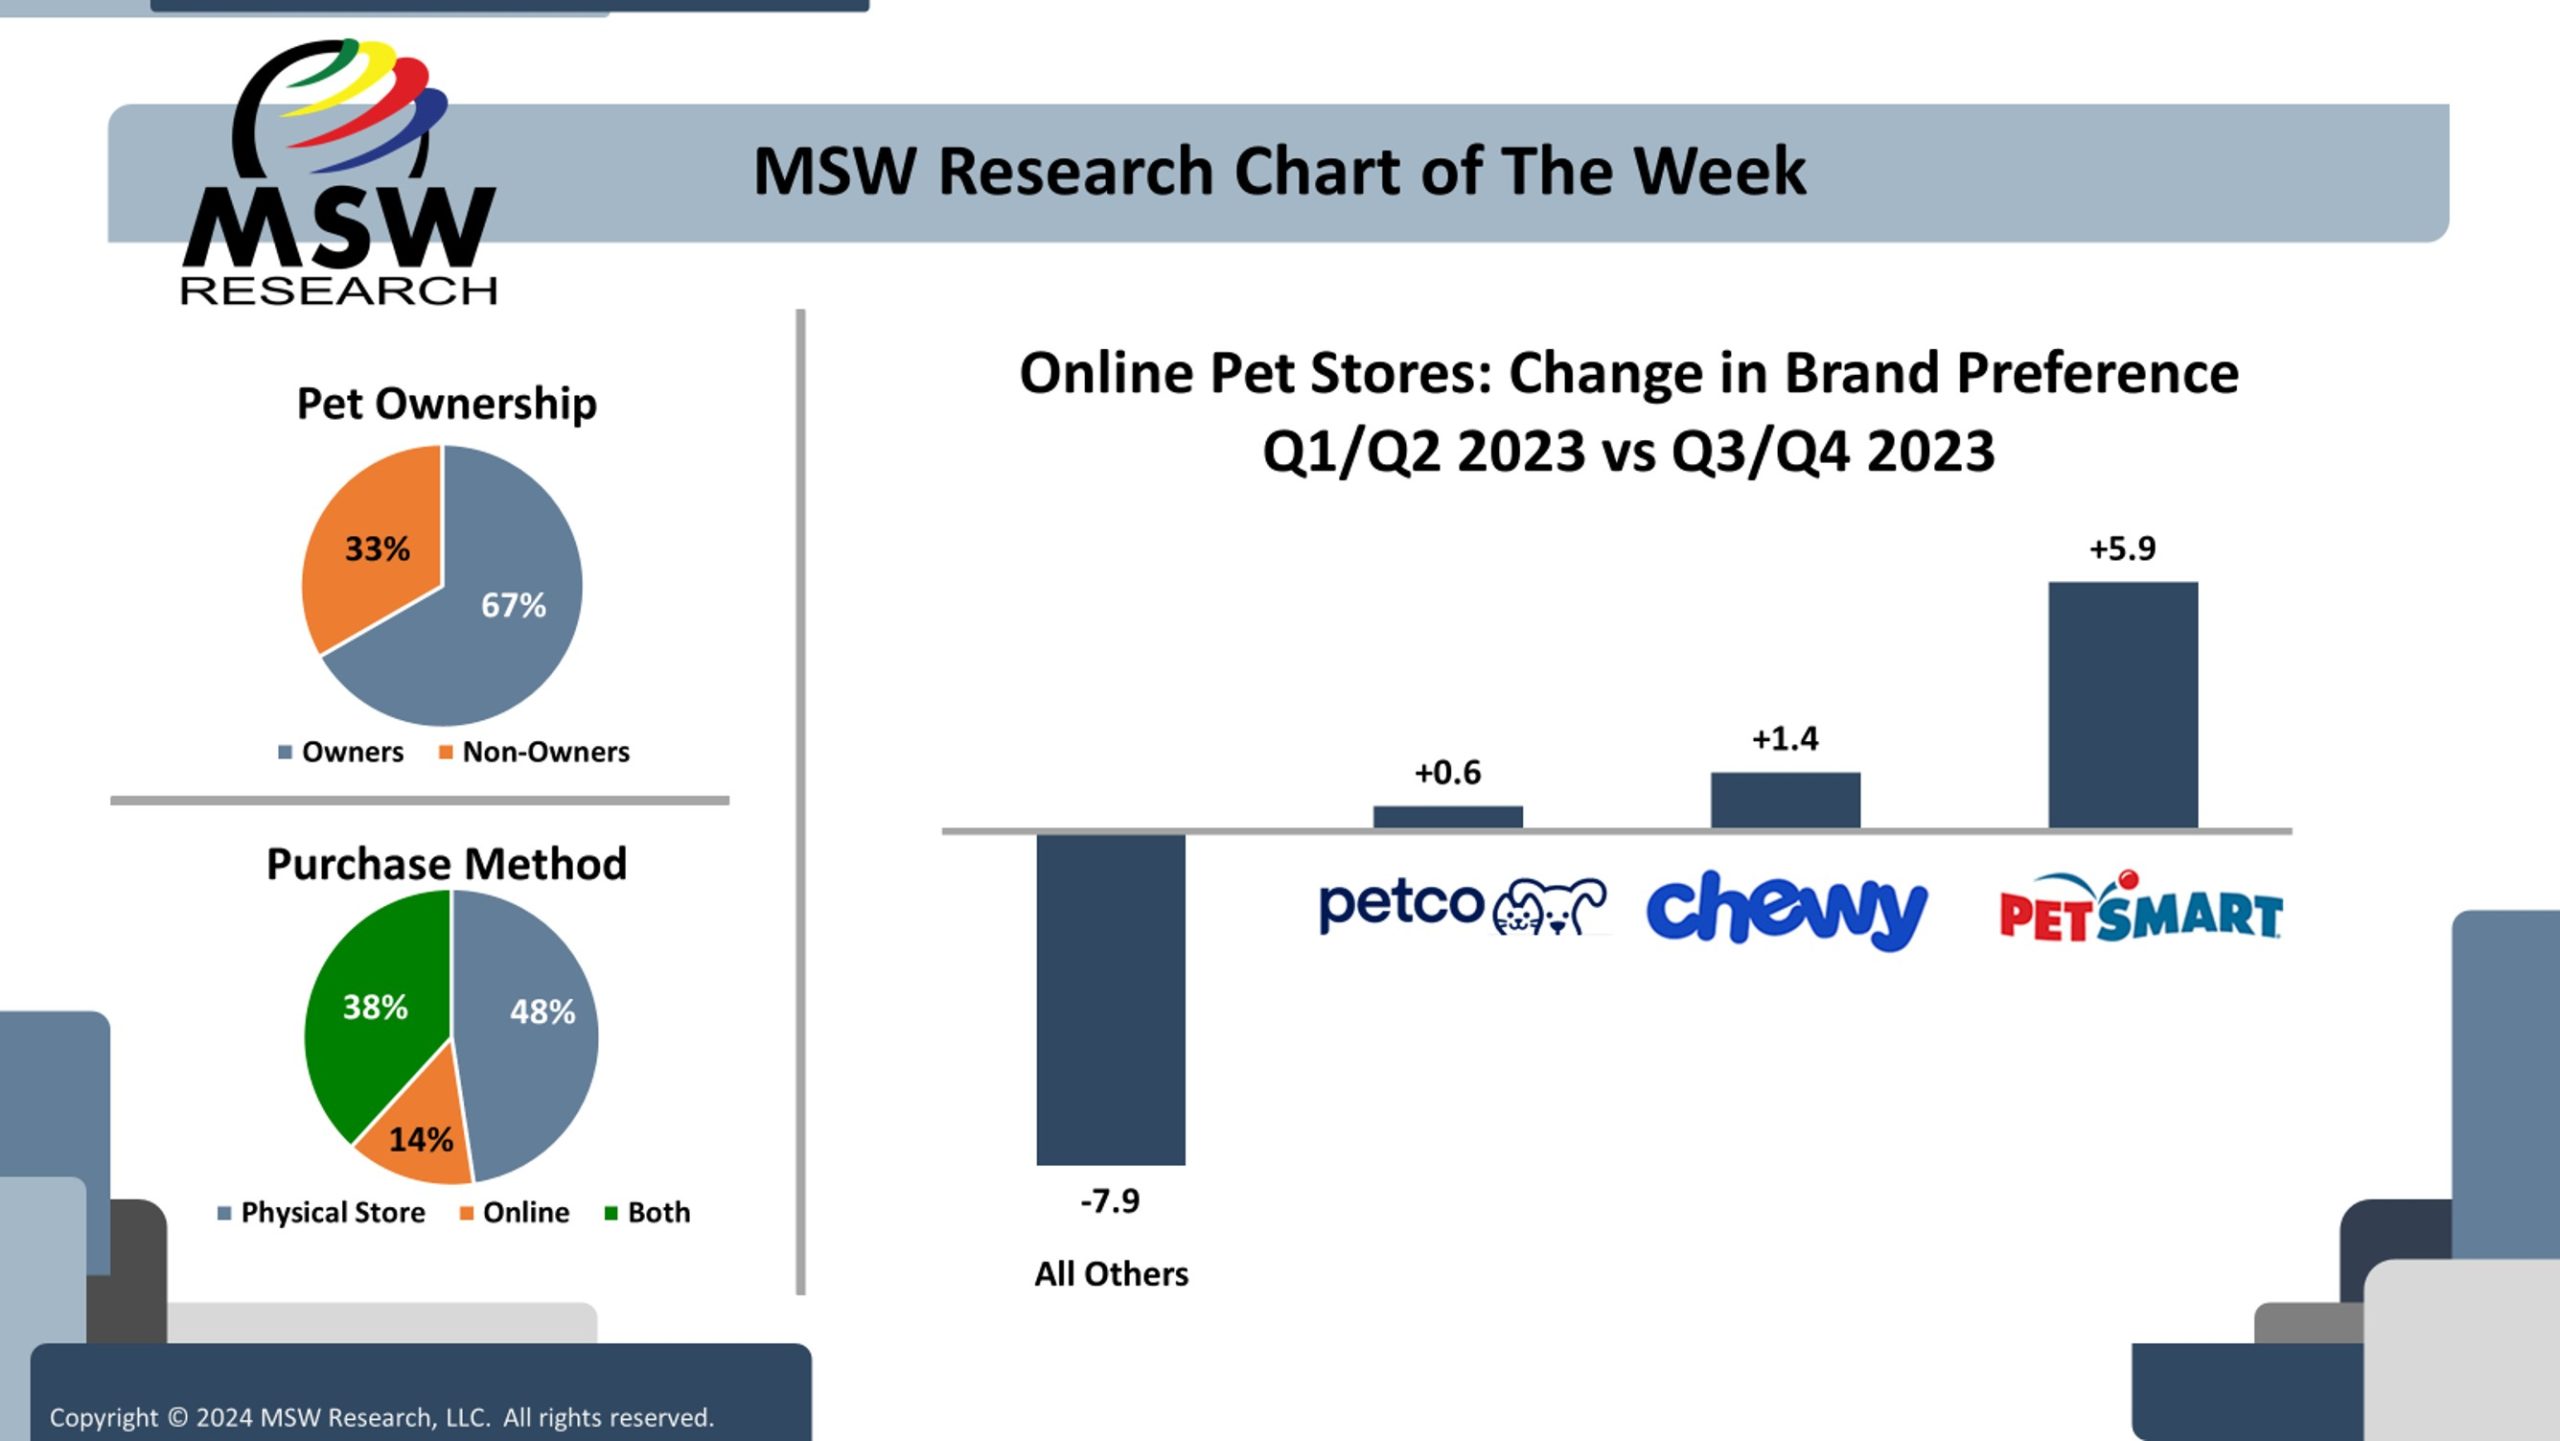
| Chart of The Week | Online Pet Stores
The MSW TBSM tracking service measures brand preference as one component of the survey. Brand preference was collected quarterly for eleven major Online Pet Store brands during 2023 (among 500 respondents each quarter). This week’s chart examines the changes in brand preference from the first half to the second half of 2023 for the three…
-

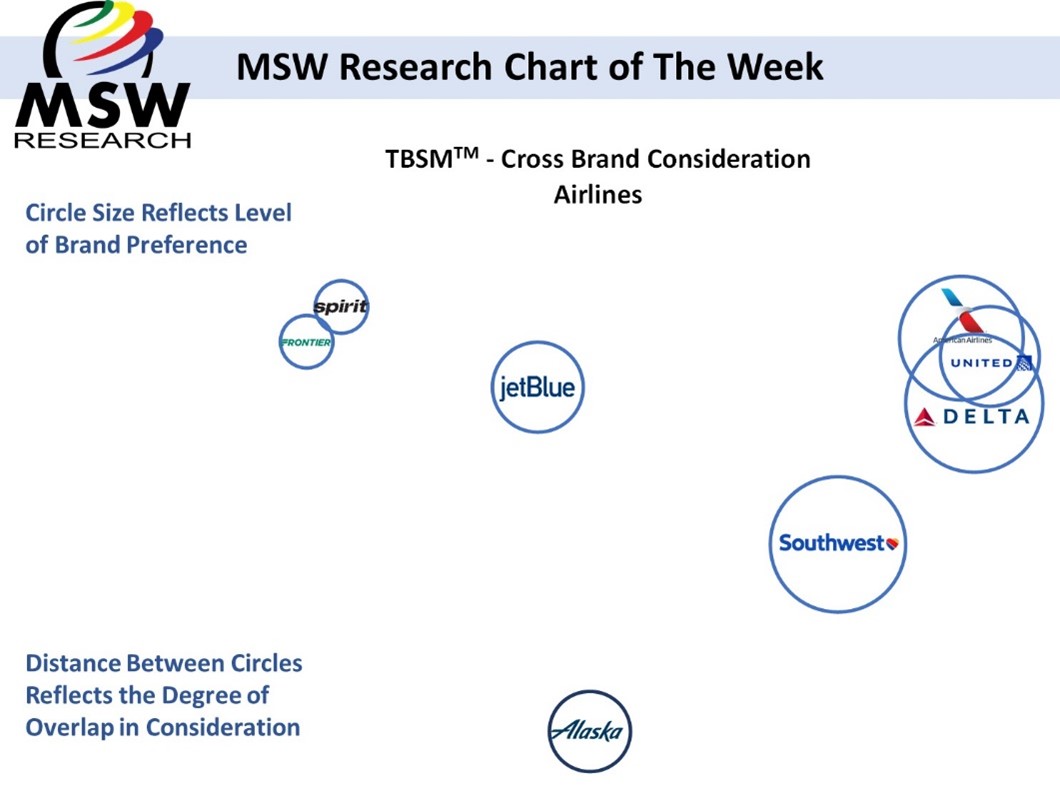
Impact of Turmoil in the Airline Industry: 2022 to 2023
The airline industry has been going through a difficult time; COVID shutdowns, Staff shortages, Inflation, weather and FAA system outages. Some airlines tried to recover from COVID too quickly and have then had to rollback planned/scheduled expansions. The result is misery for passengers, who can expect long lines, packed flights, less space on board and…
-
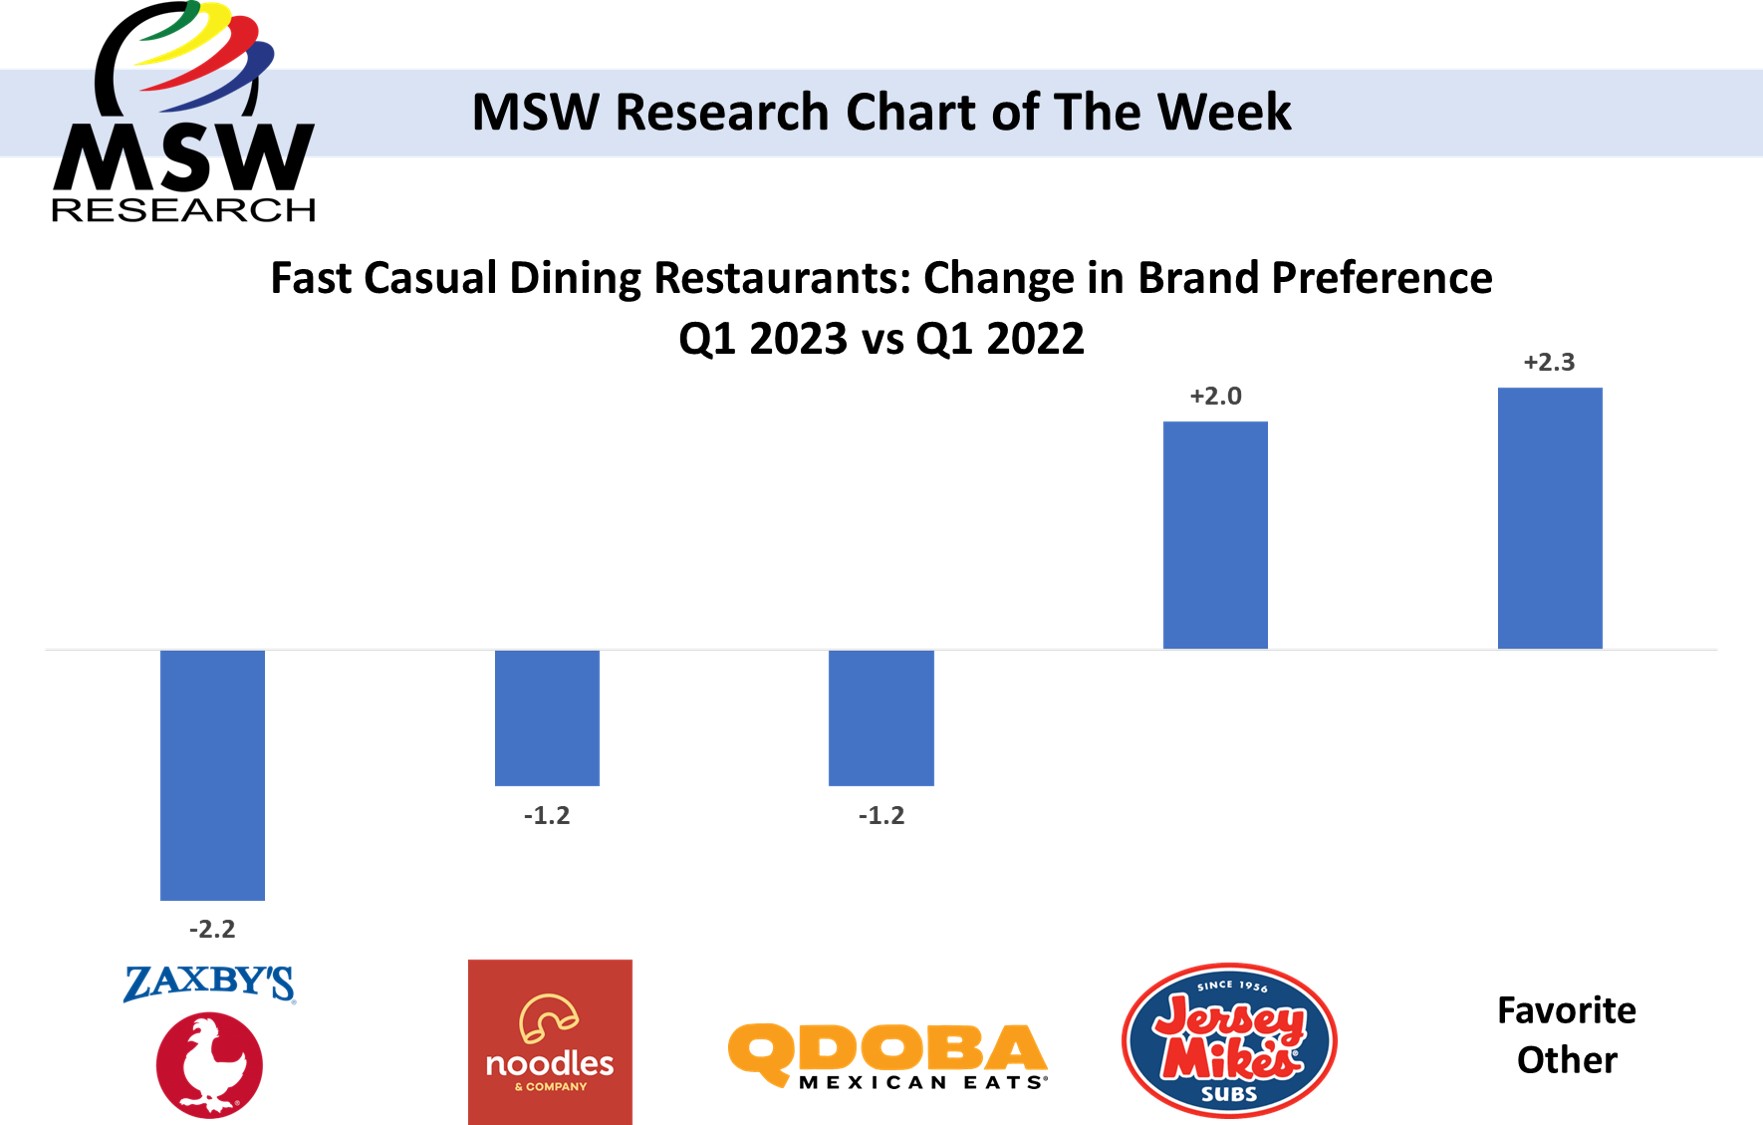
| Chart of The Week | Fast Casual Dining Restaurants: Change in Brand Preference
The MSW TBSM tracking service measures Brand Preference as one component of the survey. Brand Preference was collected for approximately twenty major Fast Casual Restaurant brands in both Q1 2022 (among 1000 demographically and geographically balanced respondents) and Q1 2023 (among 500 similarly balanced respondents). This week’s chart examines the five fast casual options that…
-
TBSM Chart of the Week 2022 Review
The MSW TBSM tracking service collects a variety of metrics across a wide range of categories. Throughout 2022, we published Charts of the Week using data drawn from the TBSM survey. Six different categories and multiple measures within each category have been explored. The categories were: • Subscription Streaming Video Services • Cryptocurrency Exchanges •…
-
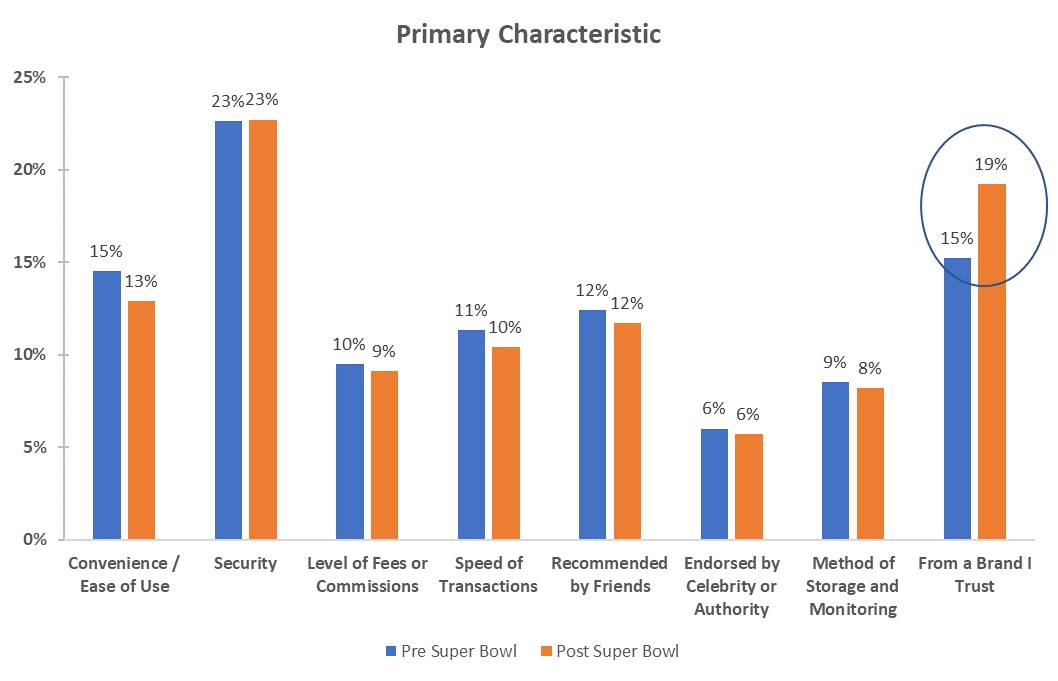
The Crypto Bowl: How Crypto Exchange Super Bowl Ads Affected Awareness and Brand Preference
As usual, there was almost as much hype about the ads in the Super Bowl this year as there was about the game itself. And one of the advertising storylines this year centered around Cryptocurrency Exchange ads. This represented a coming-out party for Crypto Exchanges on the year’s biggest advertising stage. While the four Crypto…
-
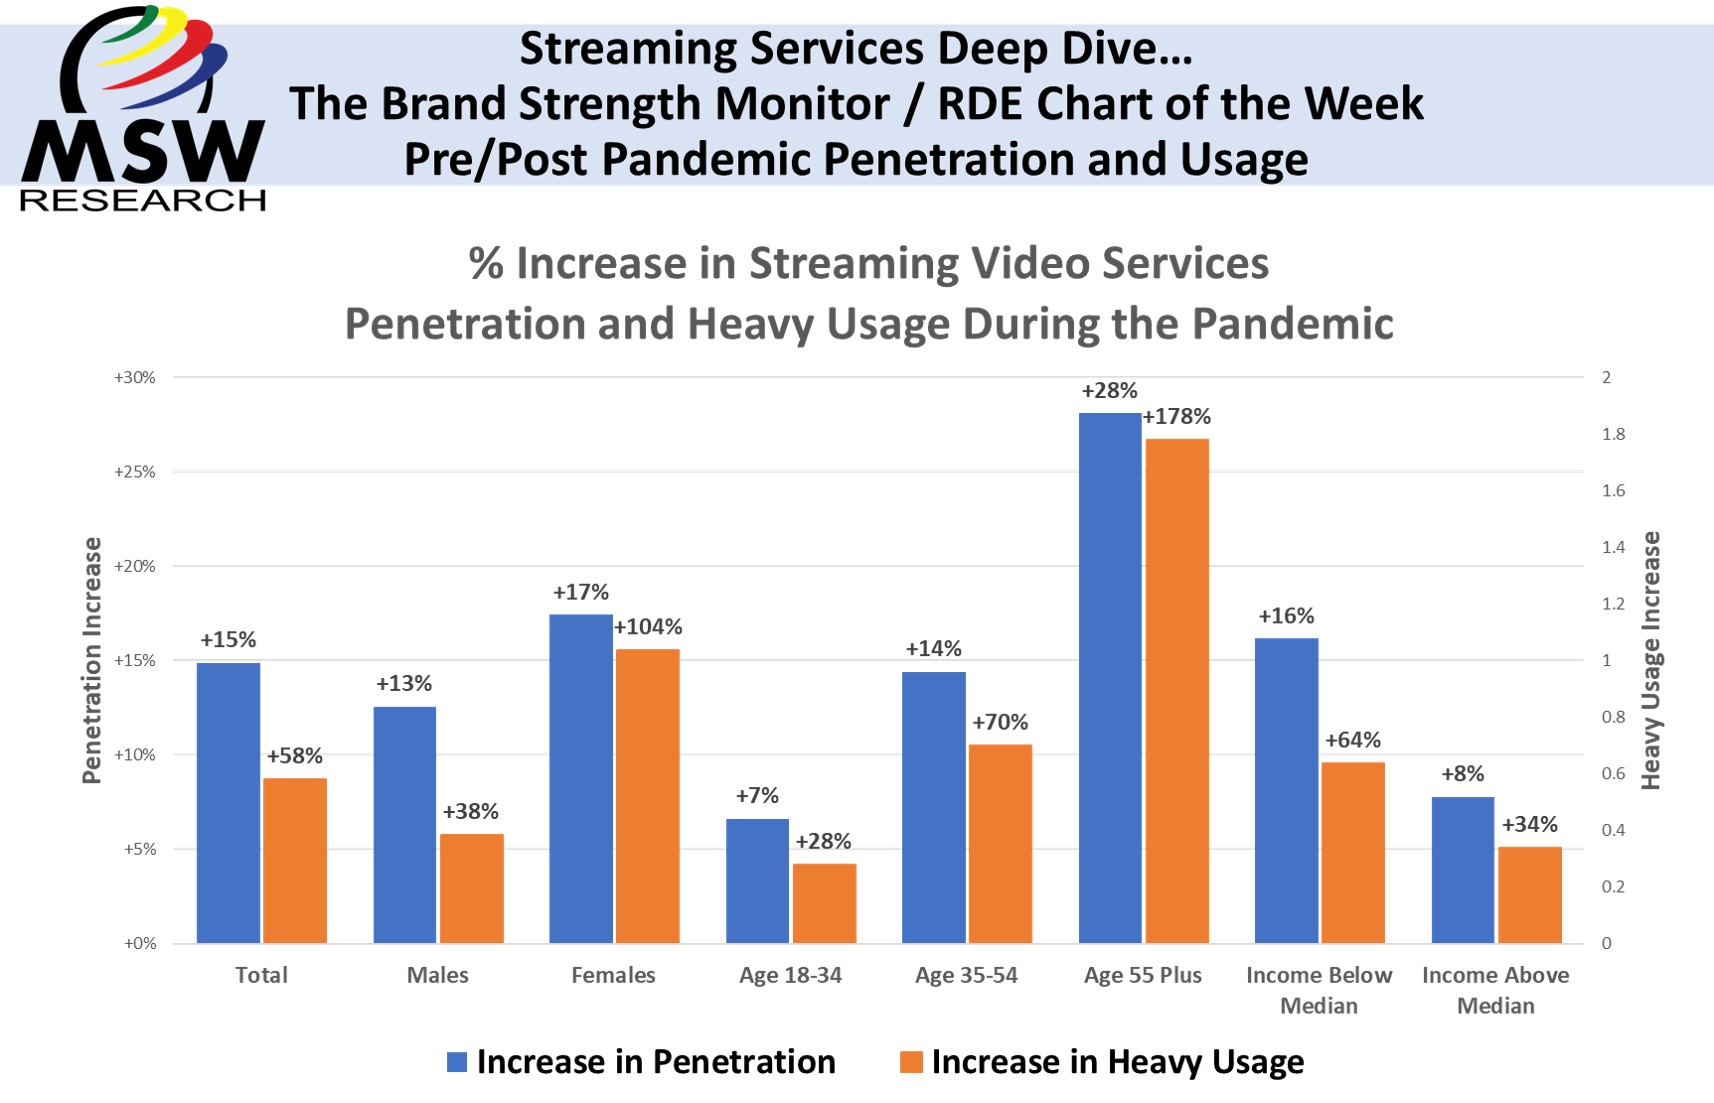
Streaming Services Deep Dive… | The Brand Strength Monitor / RDE Chart of the Week | Pre/Post Pandemic Penetration and Usage
In our last Chart of the Week we started looking at the Subscription Video Streaming Services category and specifically the pandemic winner – HBO Max. This week we’re taking a deep dive and examining the Pre/Post Pandemic Penetration and Usage by demographics. The MSW TBSM tracking service measures category penetration and level of usage as…
-
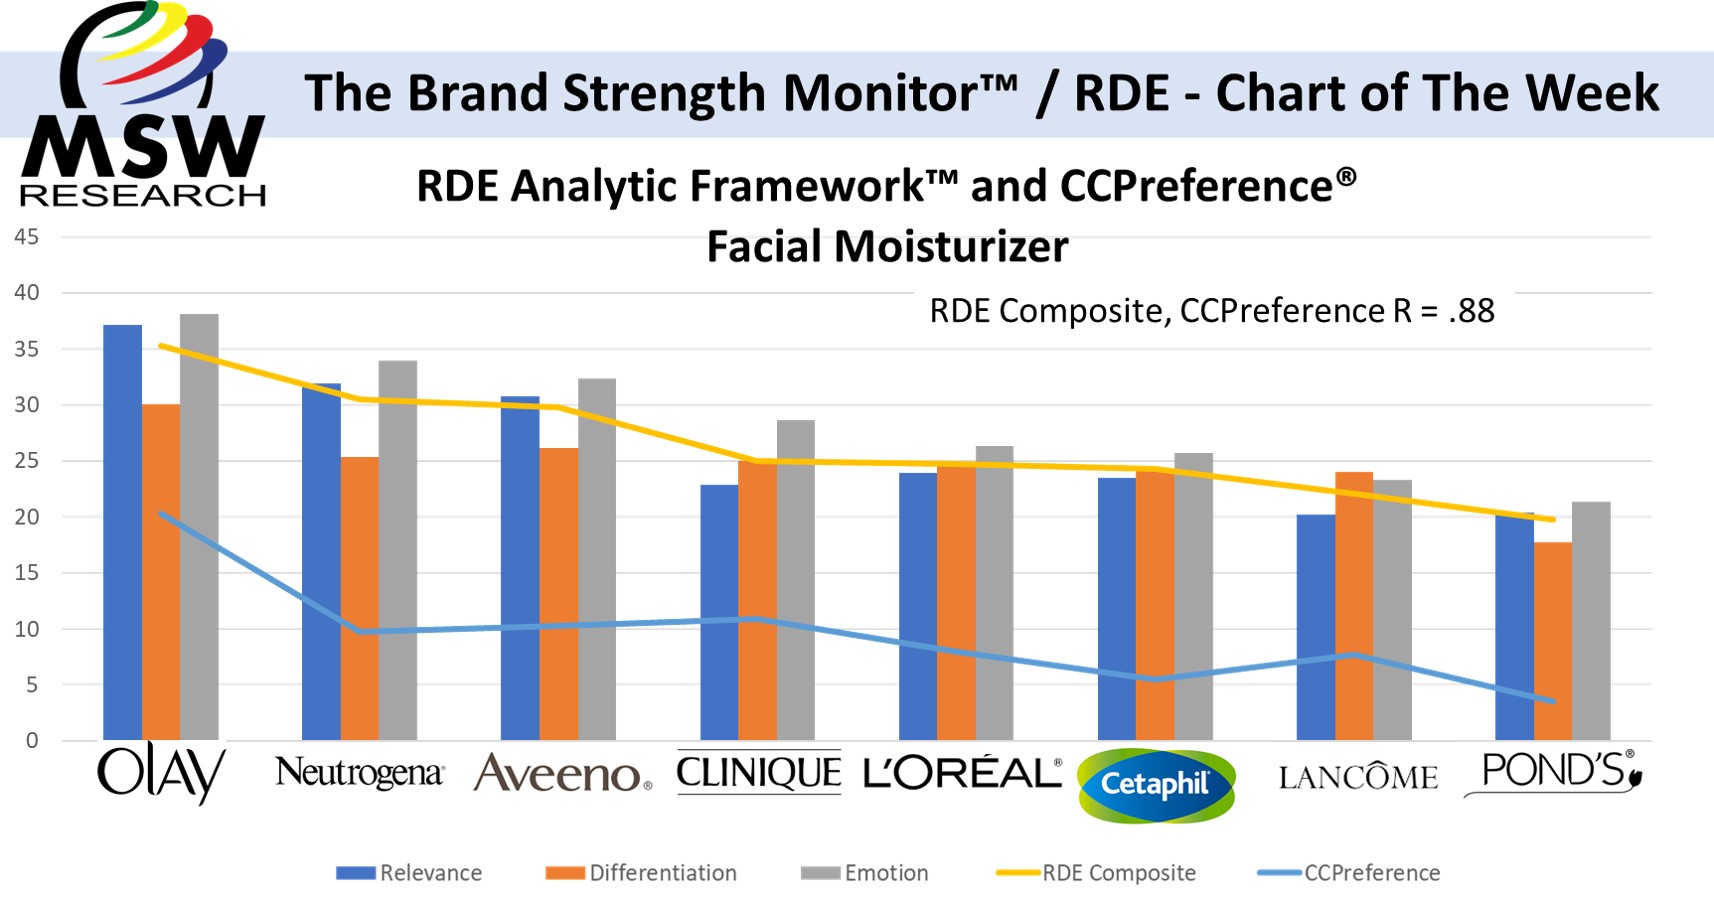
| The Brand Strength Monitor / RDE – Chart of the Week | Facial Moisturizer
MSW’s RDE Analytic Framework rests on a study that found that three equity dimensions (Relevance, Differentiation, Emotion) are responsible for driving a significant portion of brand growth. Our ongoing Chart of the Week series is dedicated to sharing RDE results for a variety of categories. If you have questions about your category or want…
-
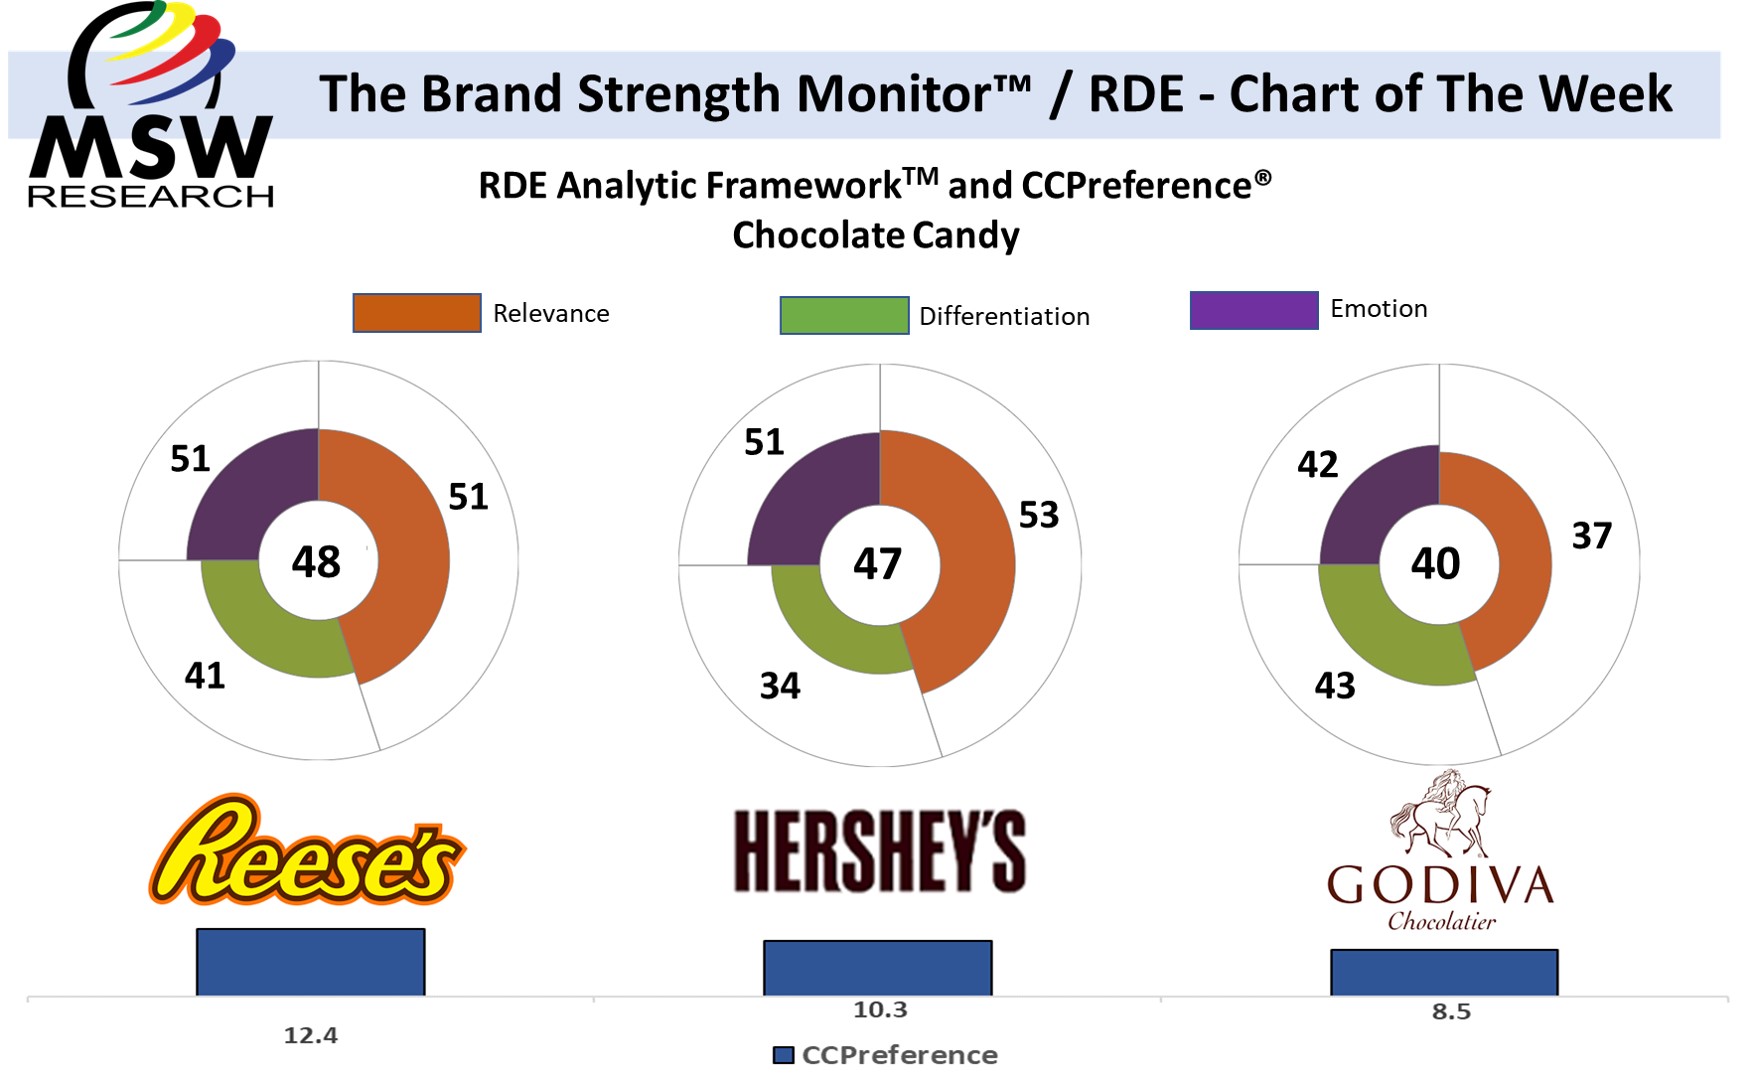
| The Brand Strength Monitor / RDE – Chart of the Week | Chocolate Candy
MSW’s RDE Analytic Framework rests on a study that found that three equity dimensions (Relevance, Differentiation, Emotion) are responsible for driving a significant portion of brand growth. Our ongoing Chart of the Week series is dedicated to sharing RDE results for a variety of categories. If you have questions about your category or want your own…